

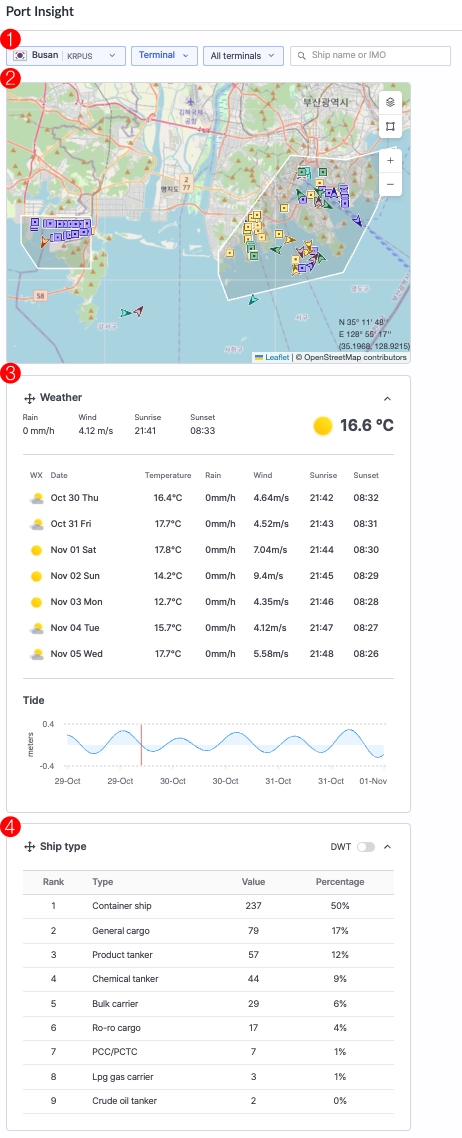
Port Insight is a real-time port intelligence and congestion analytics solution that enables users to monitor vessel traffic, port congestion, terminal operations, and maritime activity using AIS-based data.
Users can access real-time operational overviews, vessel statistics, weather and tide information, congestion indicators, and historical trend analysis through integrated map and analytics views.
Filter and Search
Users can filter and search port data by terminal, vessel, or keyword using the search bar, with data updated dynamically based on the selected conditions.
Port Insight > Filter Ports/Terminals and View, Weather & Ship Type Information
1. Port
•
Select the port you wish to view.
During the free trial, access to Busan and Long Beach ports is provided by default.
If you would like to access additional or specific ports, please contact cx@seavantage.com for assistance.
2. Terminal / Ship
•
Choose whether to display information based on terminals or ship types.
3. All Terminals / All Ships
•
Select the specific terminal or ship type to view according to your chosen criteria.
4. Search Bar
•
Enter a vessel name or IMO number to search for a specific ship.
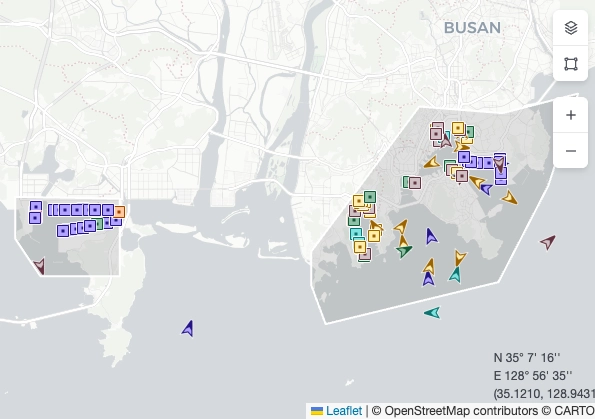
Map View
Users can view vessels associated with the port, real-time congestion levels, and the overall vessel situation directly on the map.
Vessel View
•
Vessels related to the selected port are displayed on the map, and you can check the port’s real-time congestion status.
Port Insight > Map Area > View Vessels
Notes
•
When Dashboard is selected, all vessels are displayed on the map.
•
When On the Way, Waiting, Working, or Departed is selected, only vessels in the corresponding status are shown.

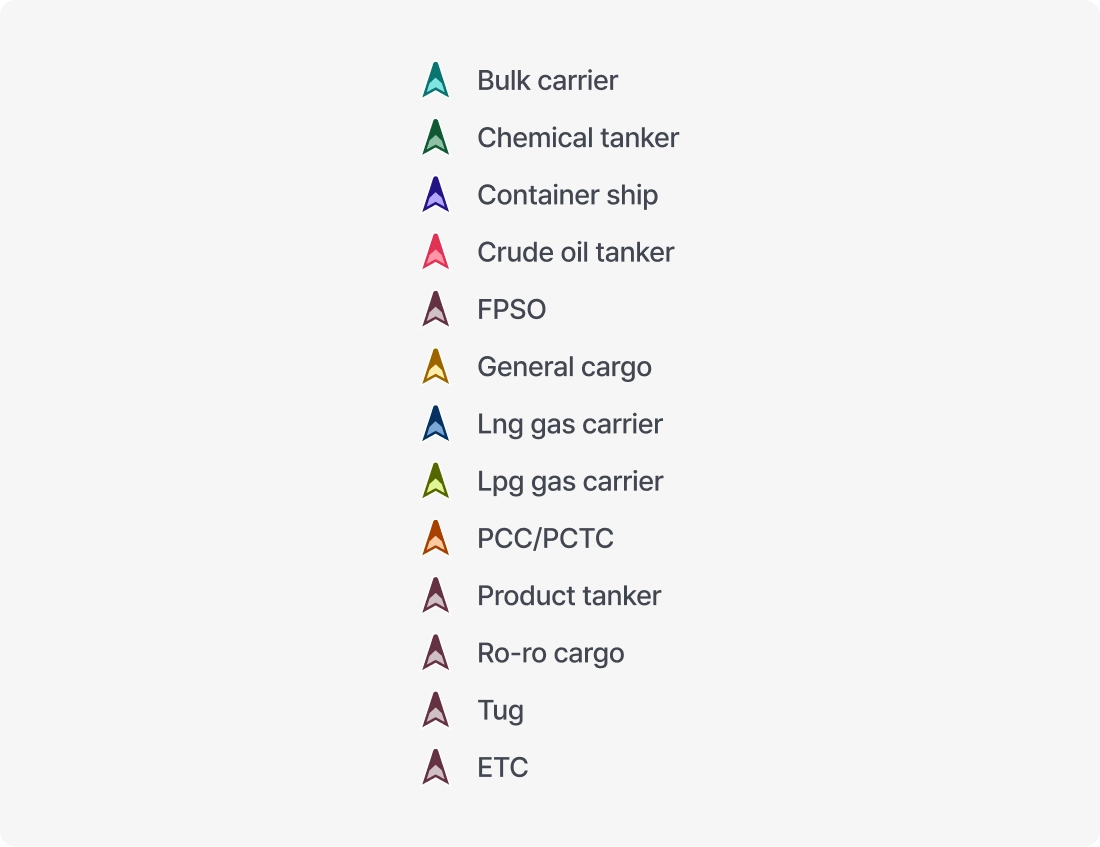
•
Vessel icons are displayed with different shapes and colors to indicate vessel type and status.

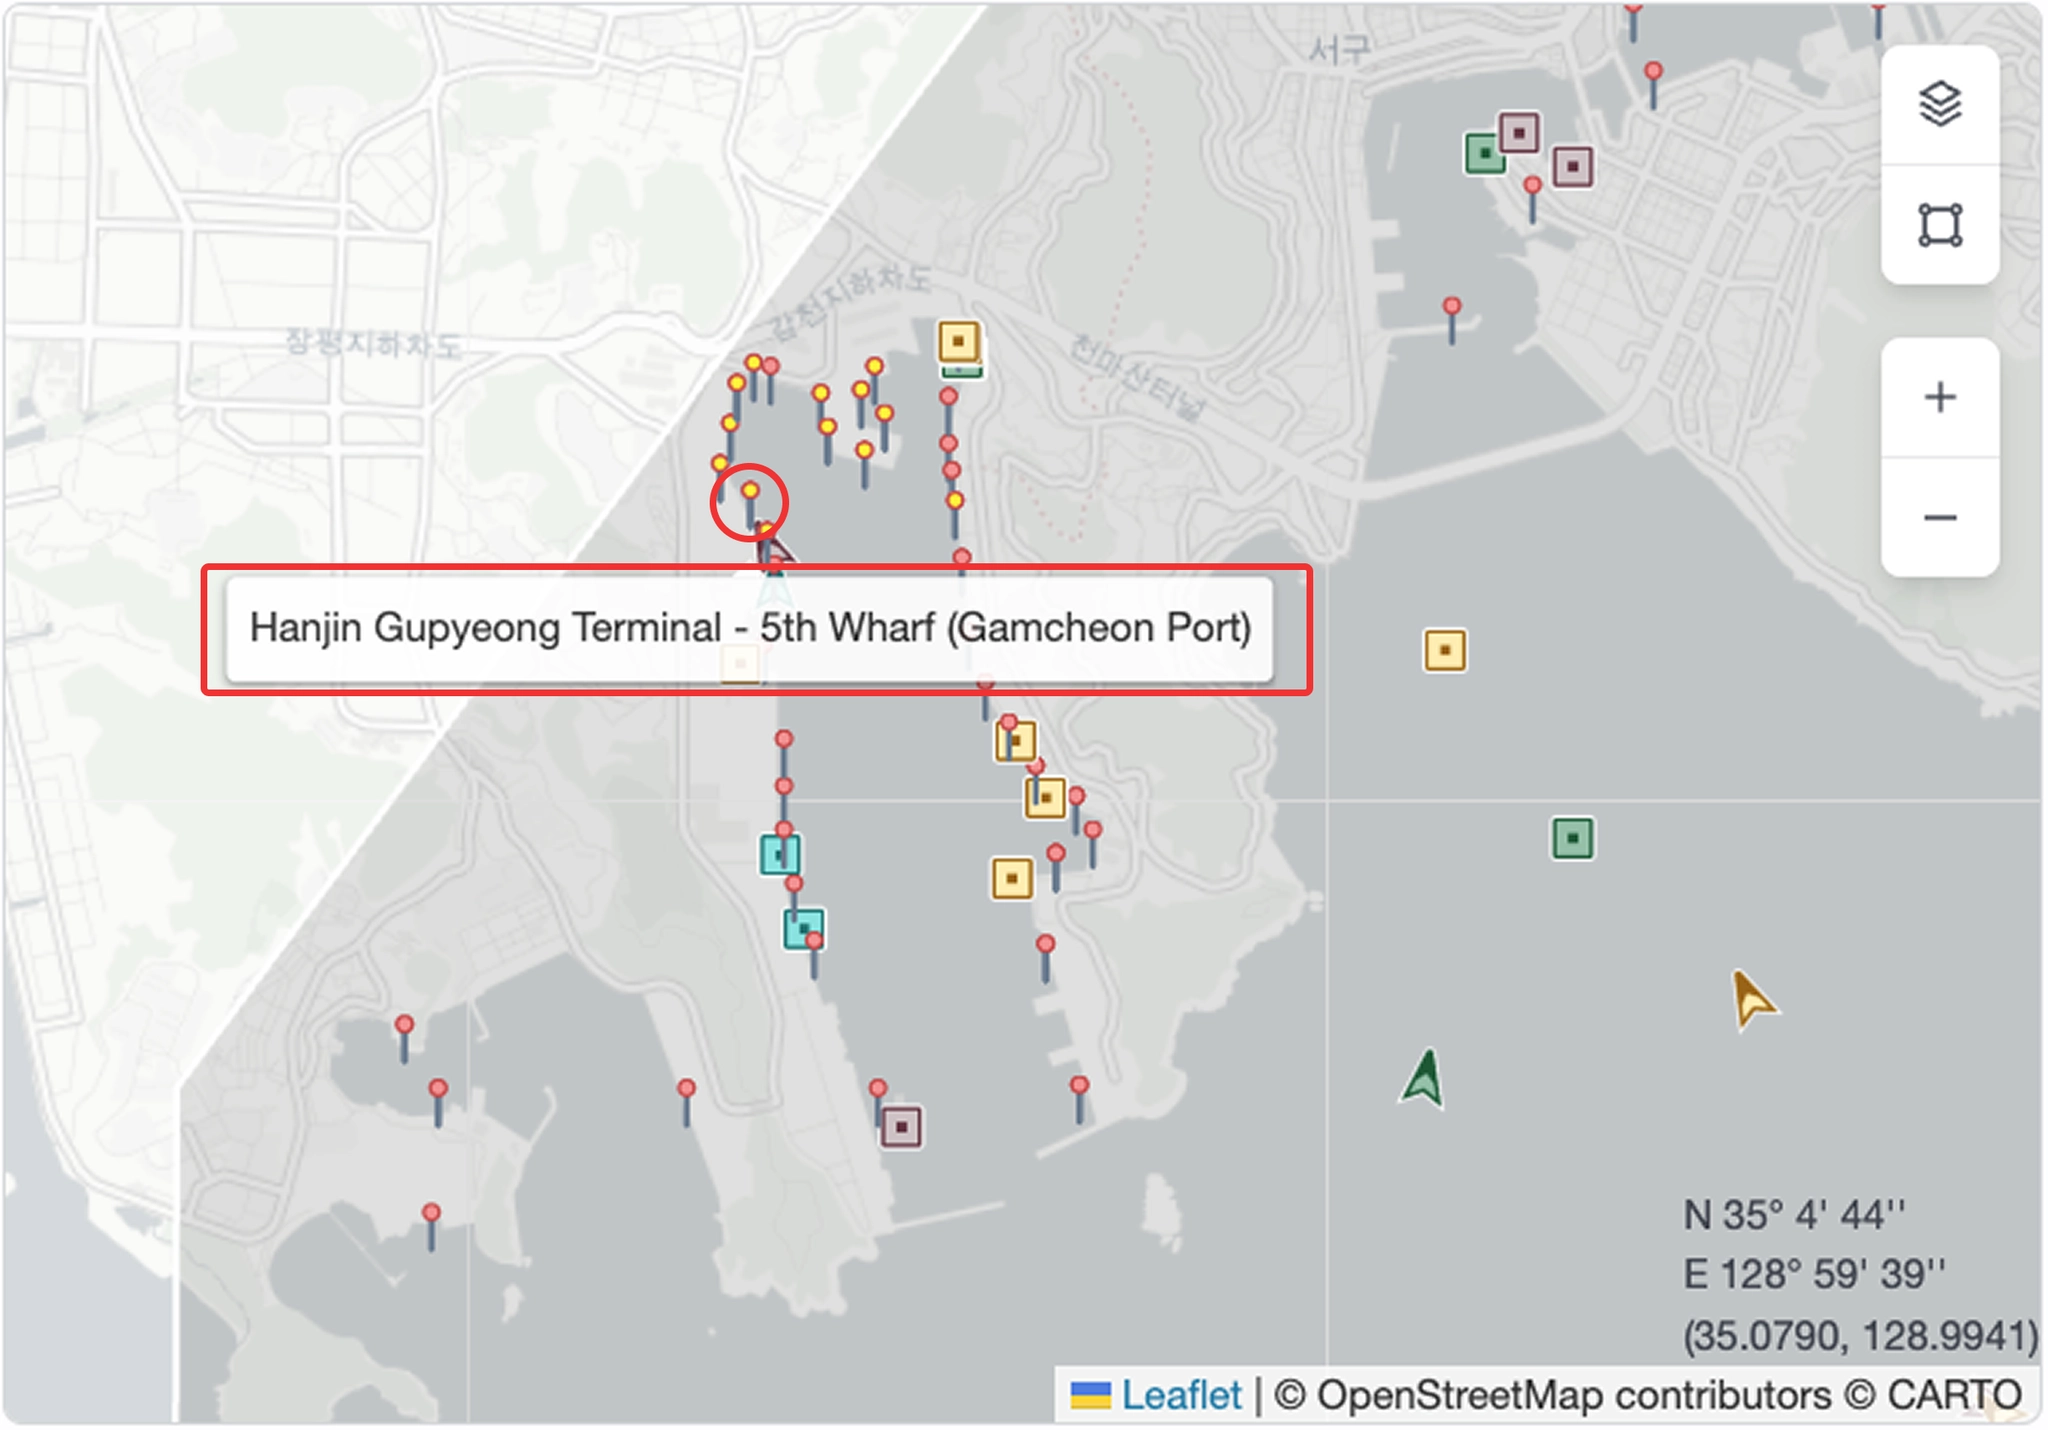
Berth View
•
When zooming in, berth locations are displayed in greater detail. Hovering over a berth shows the terminal name.
Port Insight > Map Area > View Terminal Details
Zoom In/Out
•
Use zoom controls to view detailed information such as berth locations, or zoom out to view all vessels around the port, including arriving, waiting, working, and departing vessels.
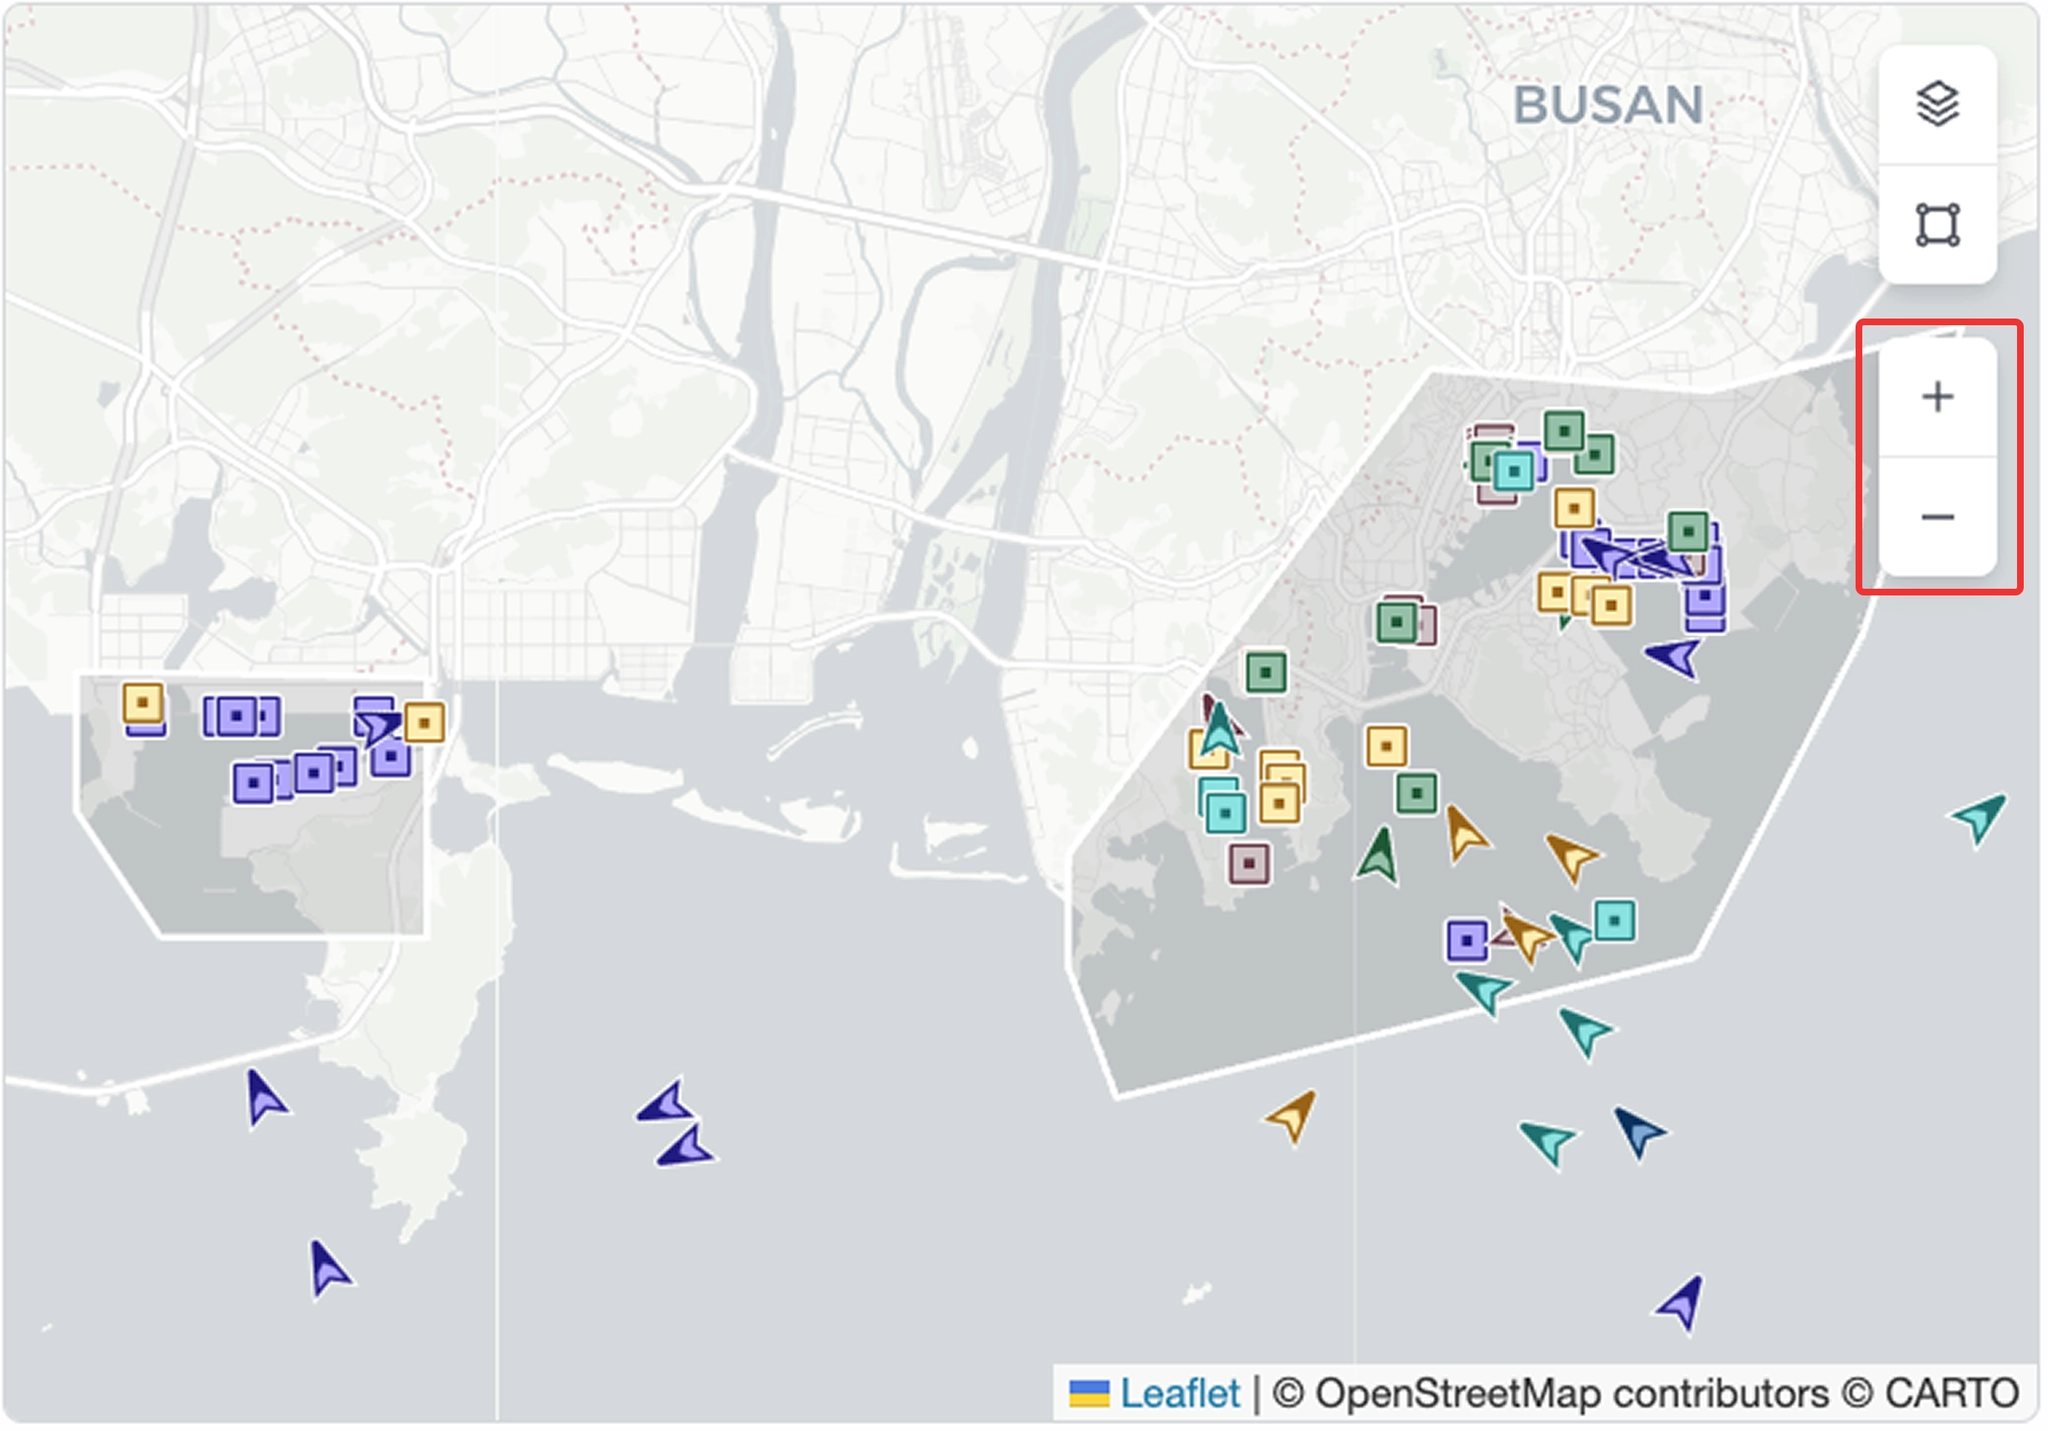
Port Insight > Map Area > Zoom In / Zoom Out
Coordinate Display
•
Shows the latitude and longitude of the cursor position on the map.
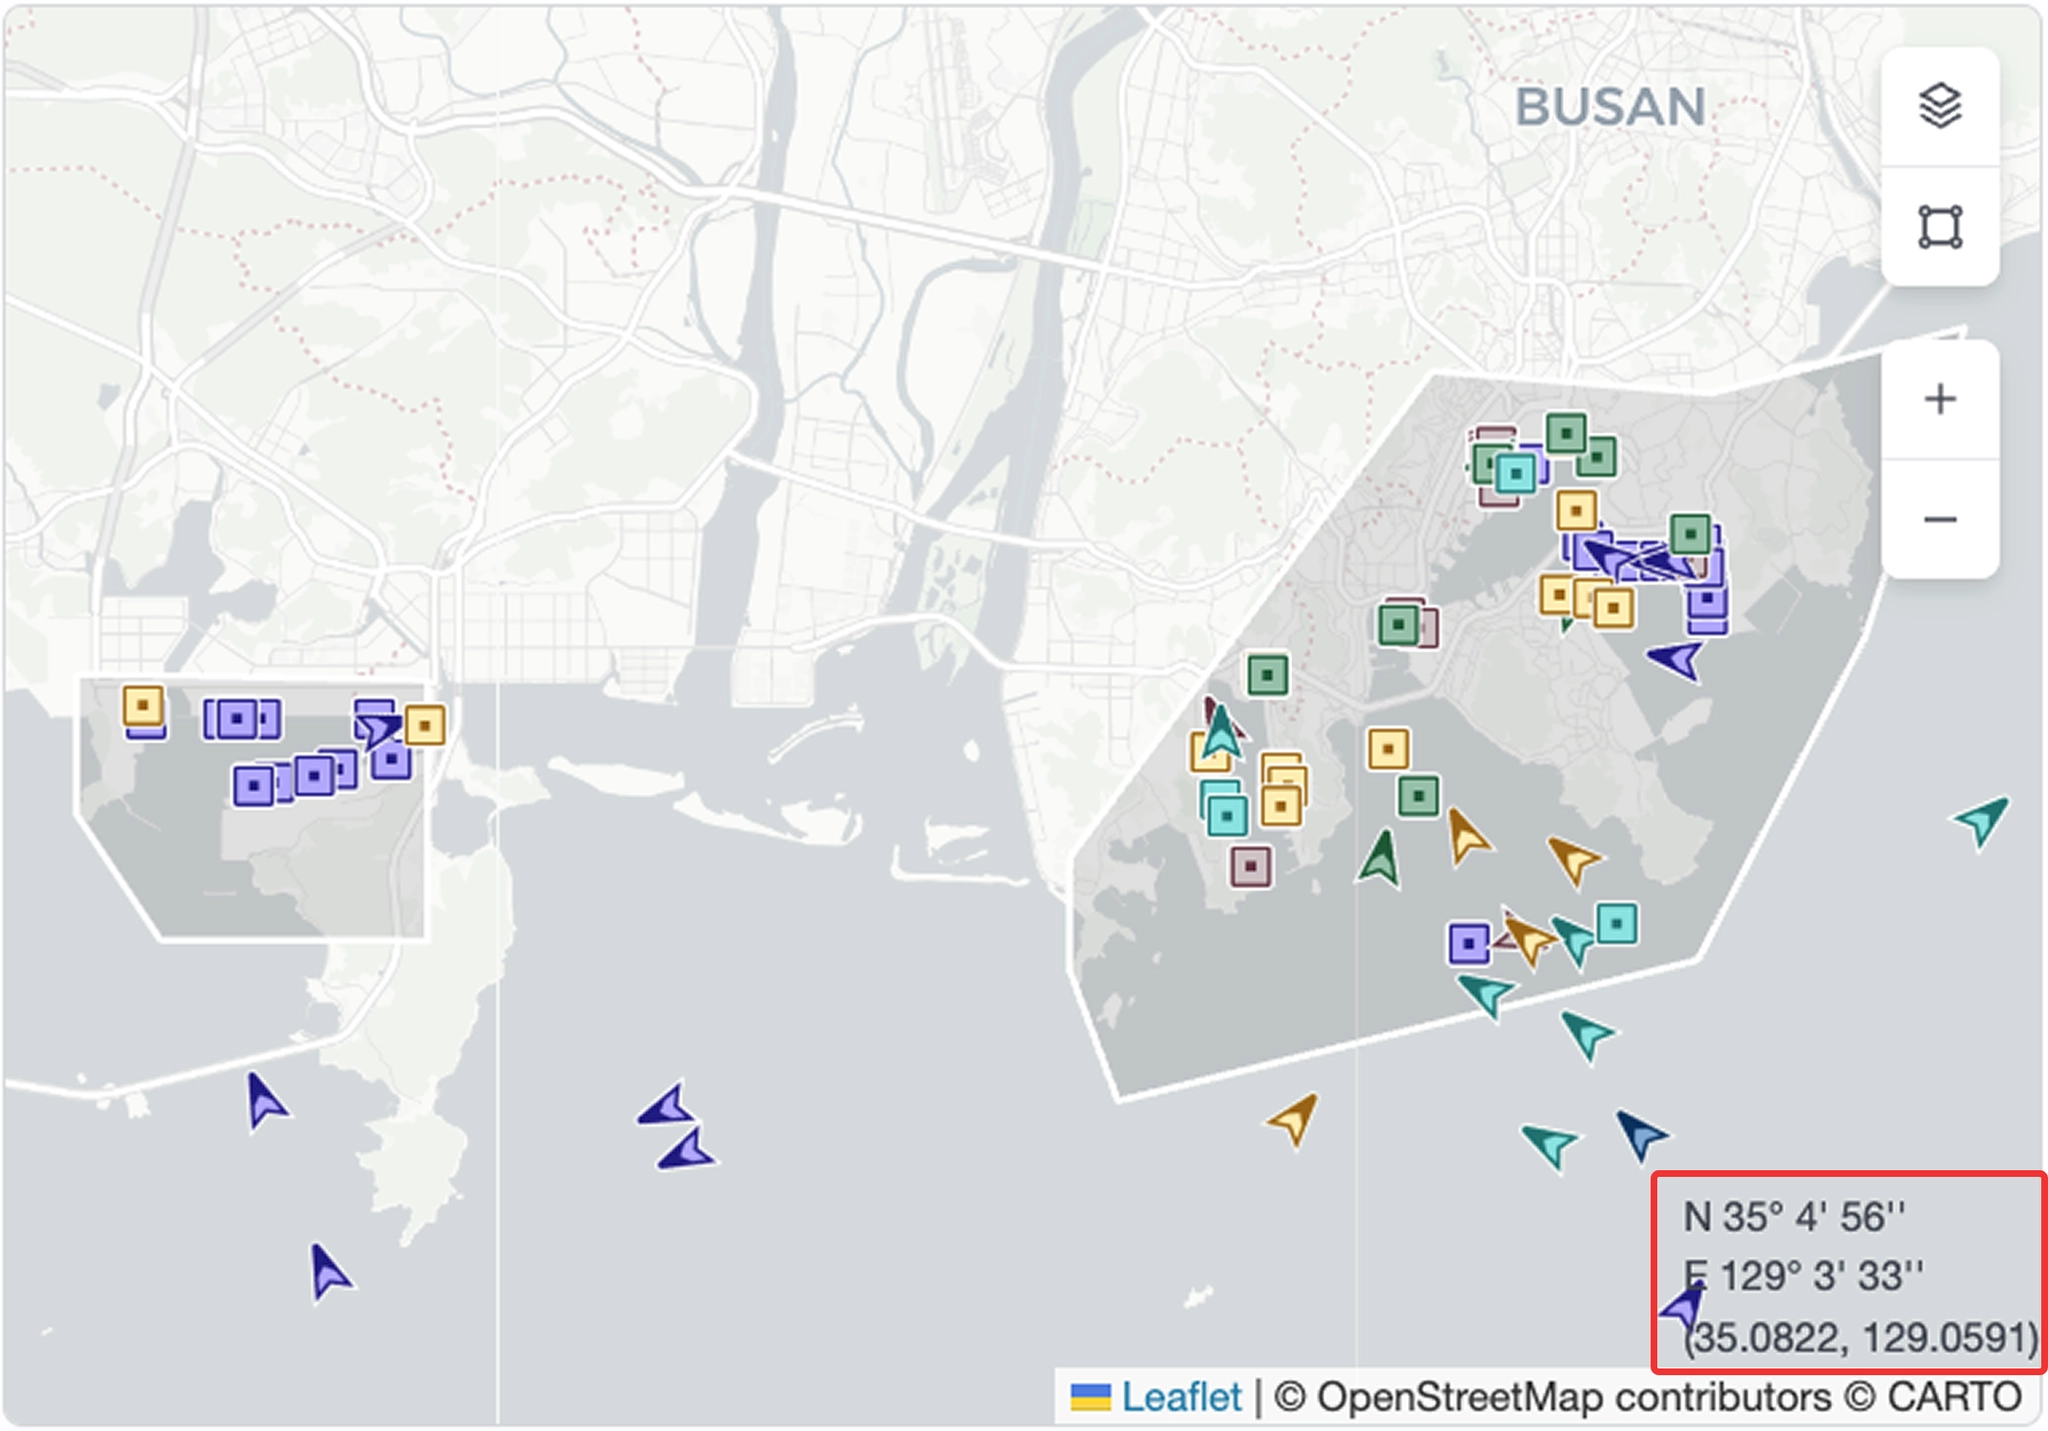
Port Insight > Map Area > View Location Coordinates
Layer
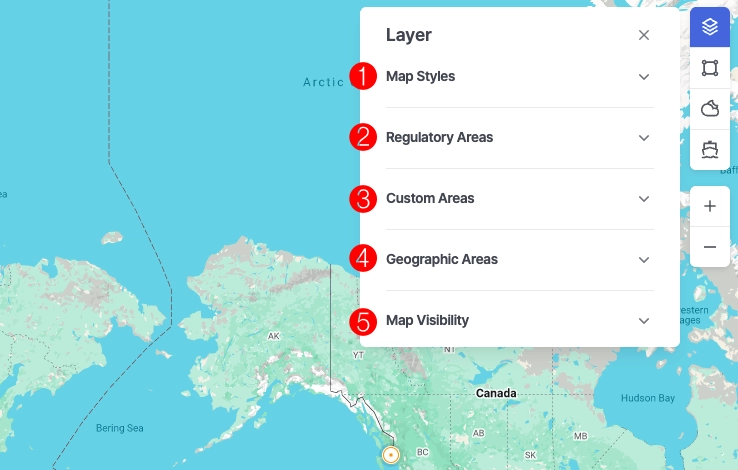
Port Insight > Map Area > Layer
1. Map Styles
•
Select the desired map style.
•
You can also change the list of available map styles displayed in the Layer panel by selecting preferred styles in Settings.
2. Regulatory Areas
•
Displays specific designated areas on the map.
◦
ECA (Emission Control Area)
◦
EEZ (Exclusive Economic Zone)
◦
JWC (Joint War Committee)
◦
HRA (High Risk Area)
◦
TSS (Traffic Separation Scheme)
◦
GPS Jamming (GPS Interference)
3. Custom Areas
•
Display user-defined areas on the map.
•
Custom areas can be created and managed in Custom Areas.
4. Geographic Areas
•
Display incidents, alerts, and risk zones defined by SeaVantage on the map.
5. Map Visibility
•
Ship names : Show or hide vessel names displayed on the map.
Tools
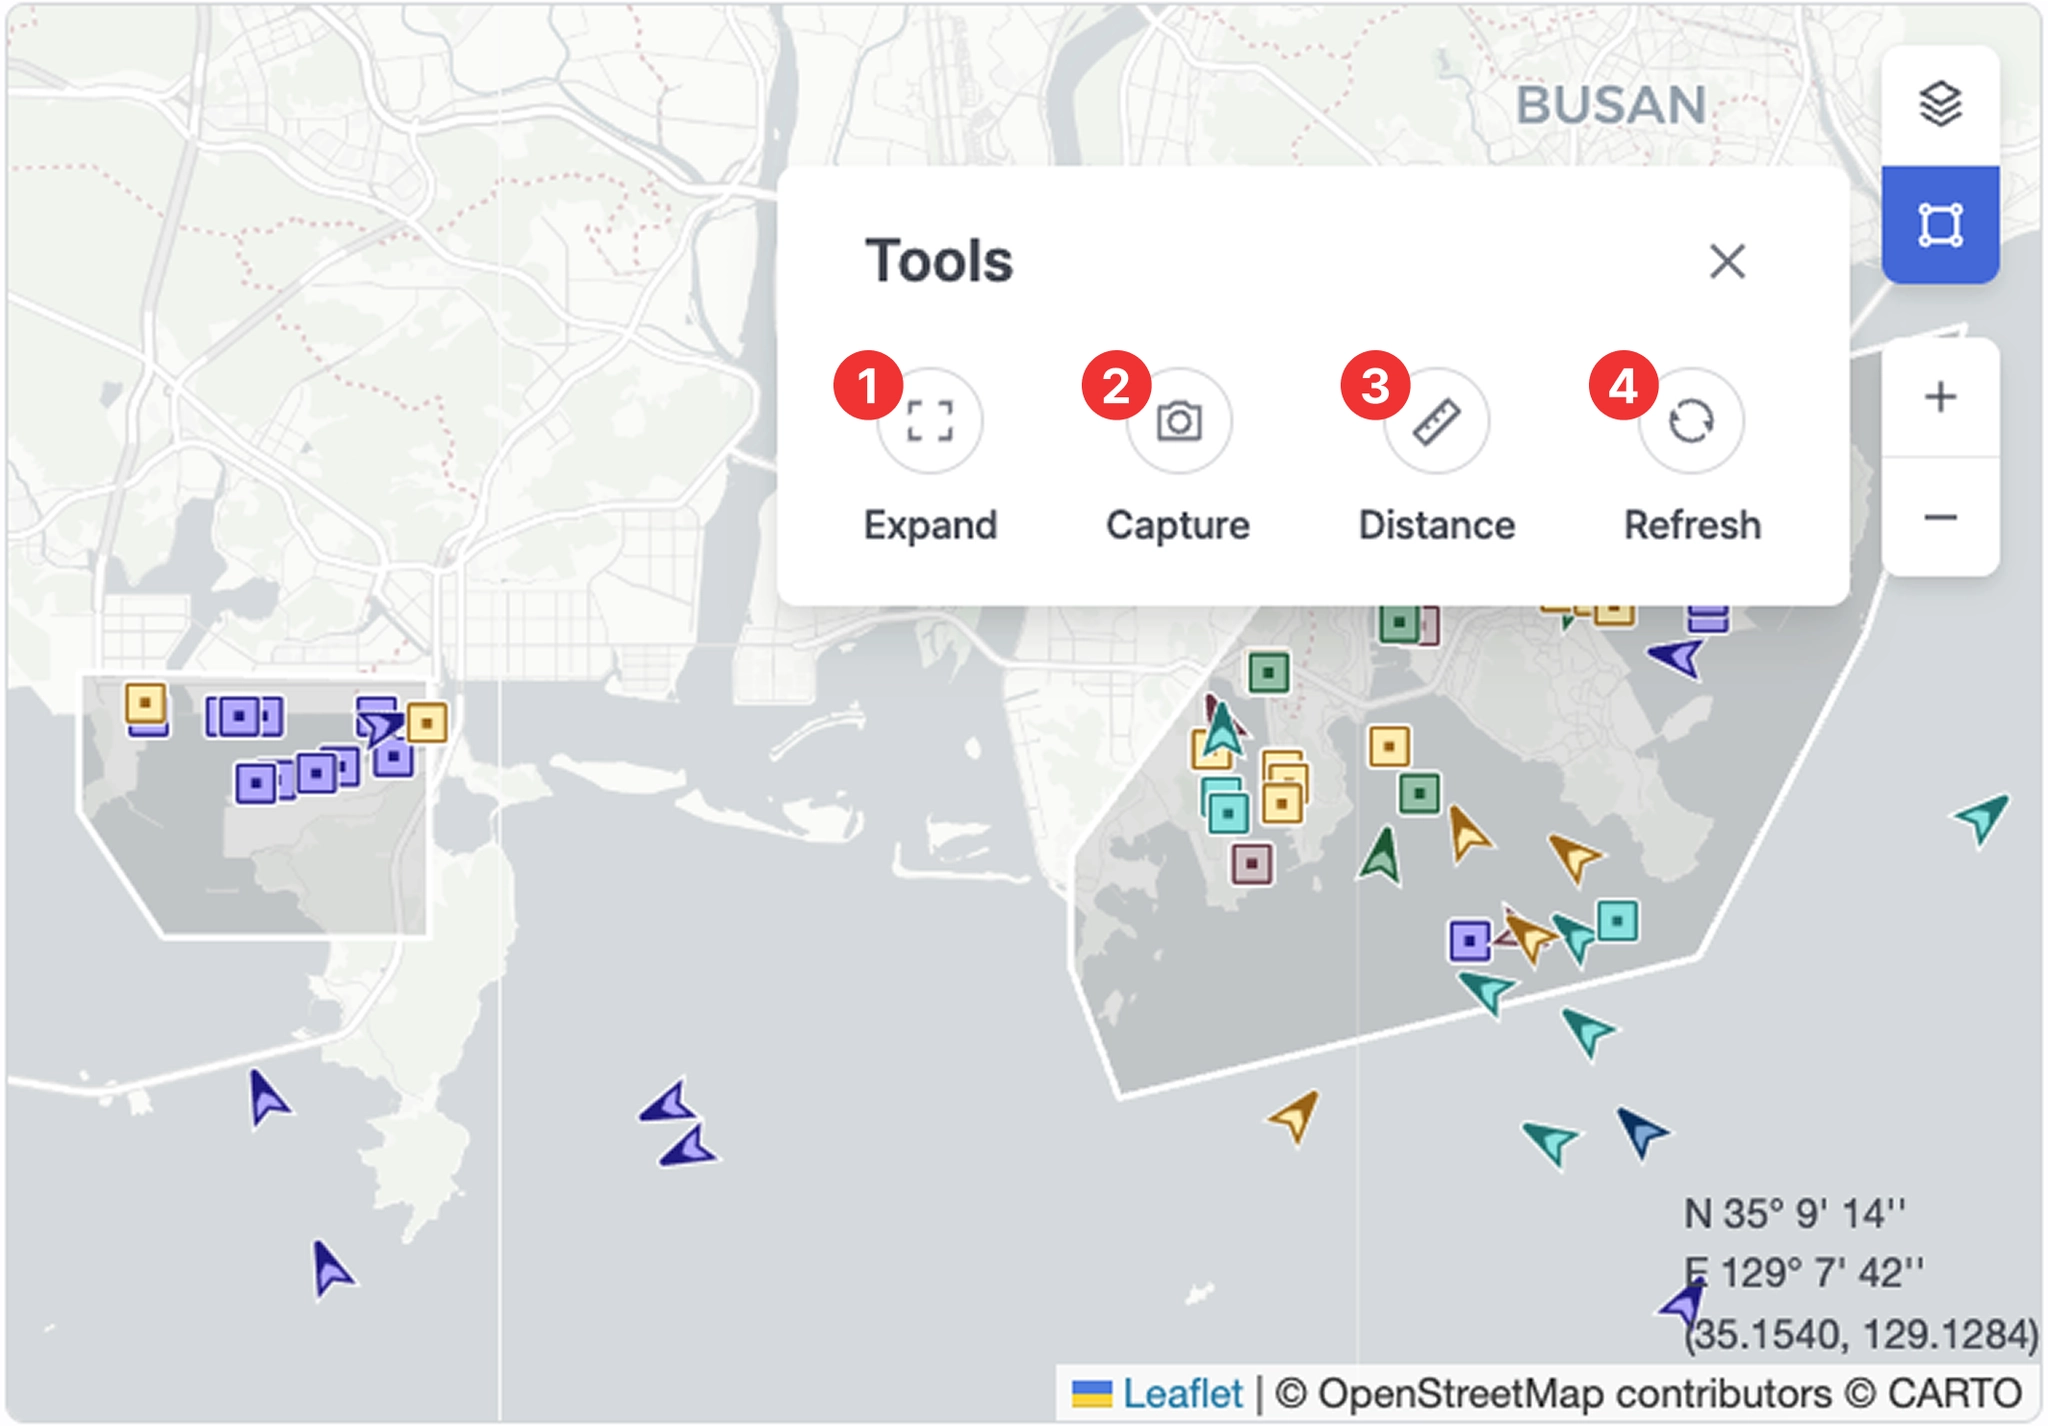
Port Insight > Map Area > Tools
1. Expand
•
Switches the screen to fullscreen mode to view information more clearly.
•
Press Esc to exit fullscreen.
2. Capture
•
Saves the current screen as an image for sharing or documentation.
3. Distance
•
A measurement tool used to check the distance between selected points.
•
Click the starting point and the destination to view Bearing, Great Circle Distance, and Rhumb Line Distance.
•
Click multiple points to draw the measurement path. Double-click to complete the line.
•
Click again to start a new measurement.
•
Press Esc or click the Distance button again to exit the measurement mode.
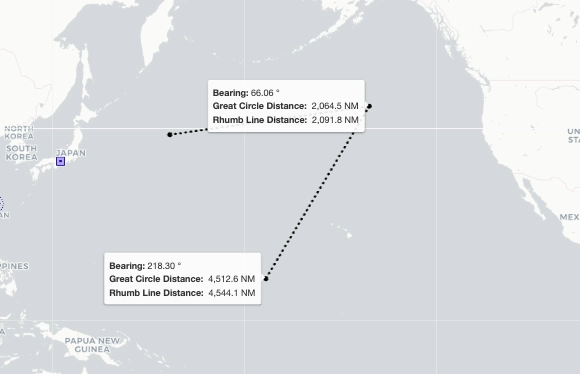
Port Insight > Map Area > Tools > Distance
4. Refresh
•
Reloads the latest data and updates the map immediately.
Weather and Tide Overview
Users can view weather and tide information to support vessel operations and port planning.
Weather
•
You can view the current weather conditions for the selected port.

Port Insight > Weather
No. | Item | Description |
1 | Rain | Precipitation |
2 | Wind | Wind Speed |
3 | Sunrise | Sunrise Time |
4 | Sunset | Sunset Time |
5 | Temperature | Temperature |
•
You can also view daily weather information.
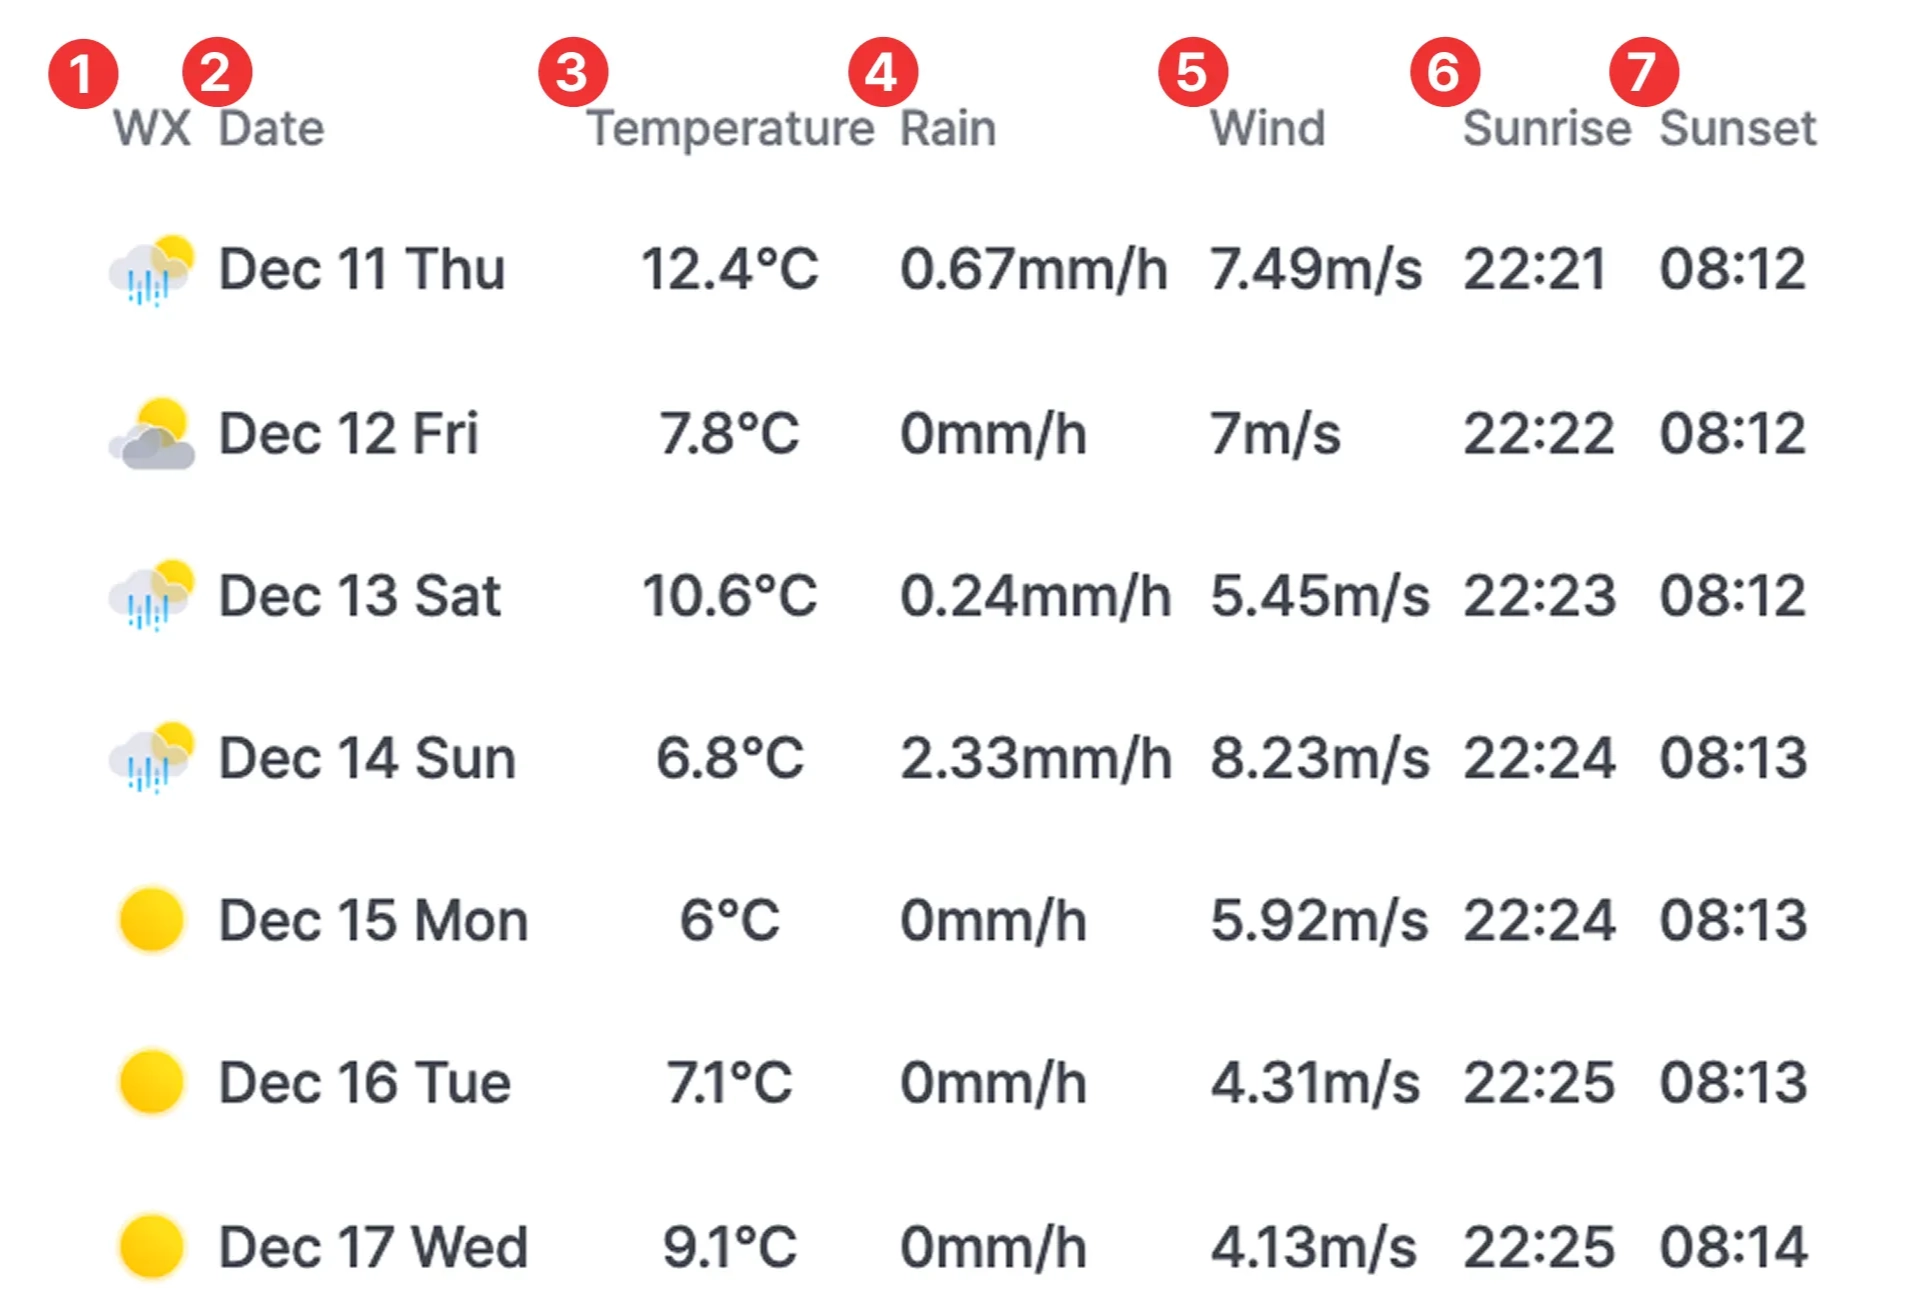
Port Insight > Weather
No. | Item | Description |
1 | WX | Weather icon |
2 | Date | Date |
3 | Temperature | Temperature |
4 | Rain | Precipitation |
5 | Wind | Wind speed |
6 | Sunrise | Sunrise time |
7 | Sunset | Sunset time |
Tide
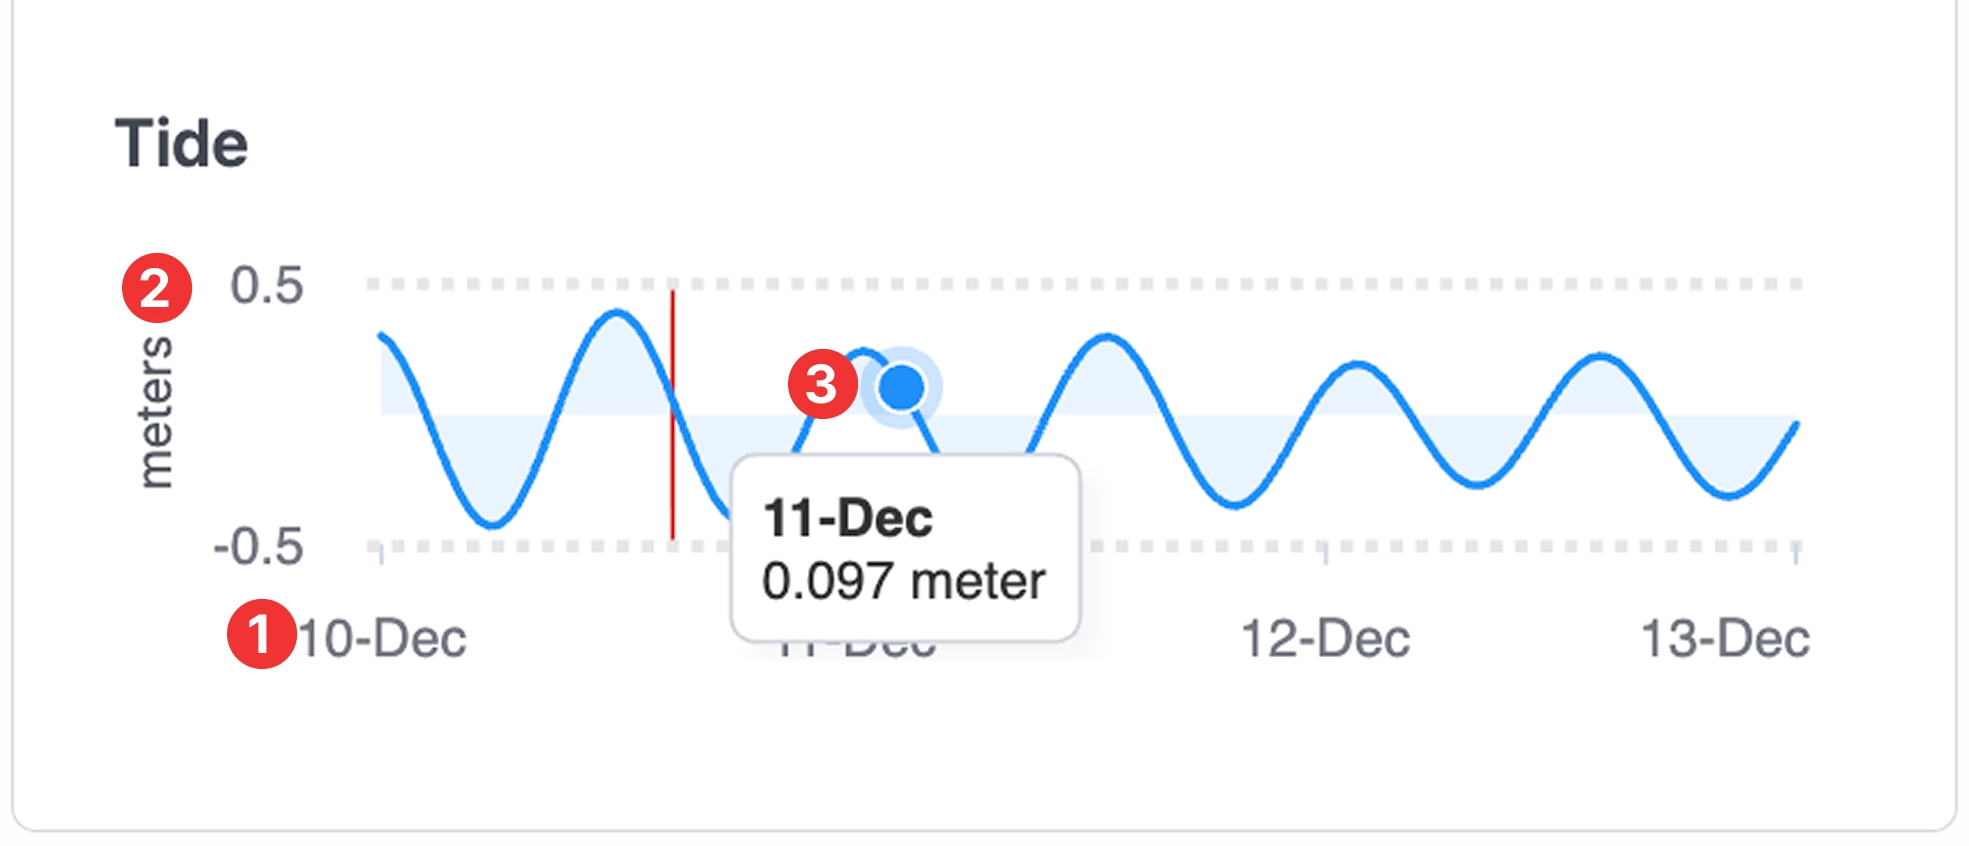
Port Insight > Tide
No. | Item | Description |
1 | X-axis | Date |
2 | Y-axis | Tide height |
3 | Tooltip | Displays the exact date and tide height (meters) for the selected point |
Ship Type
Users can view vessel count and DWT rankings by ship type for the selected port.
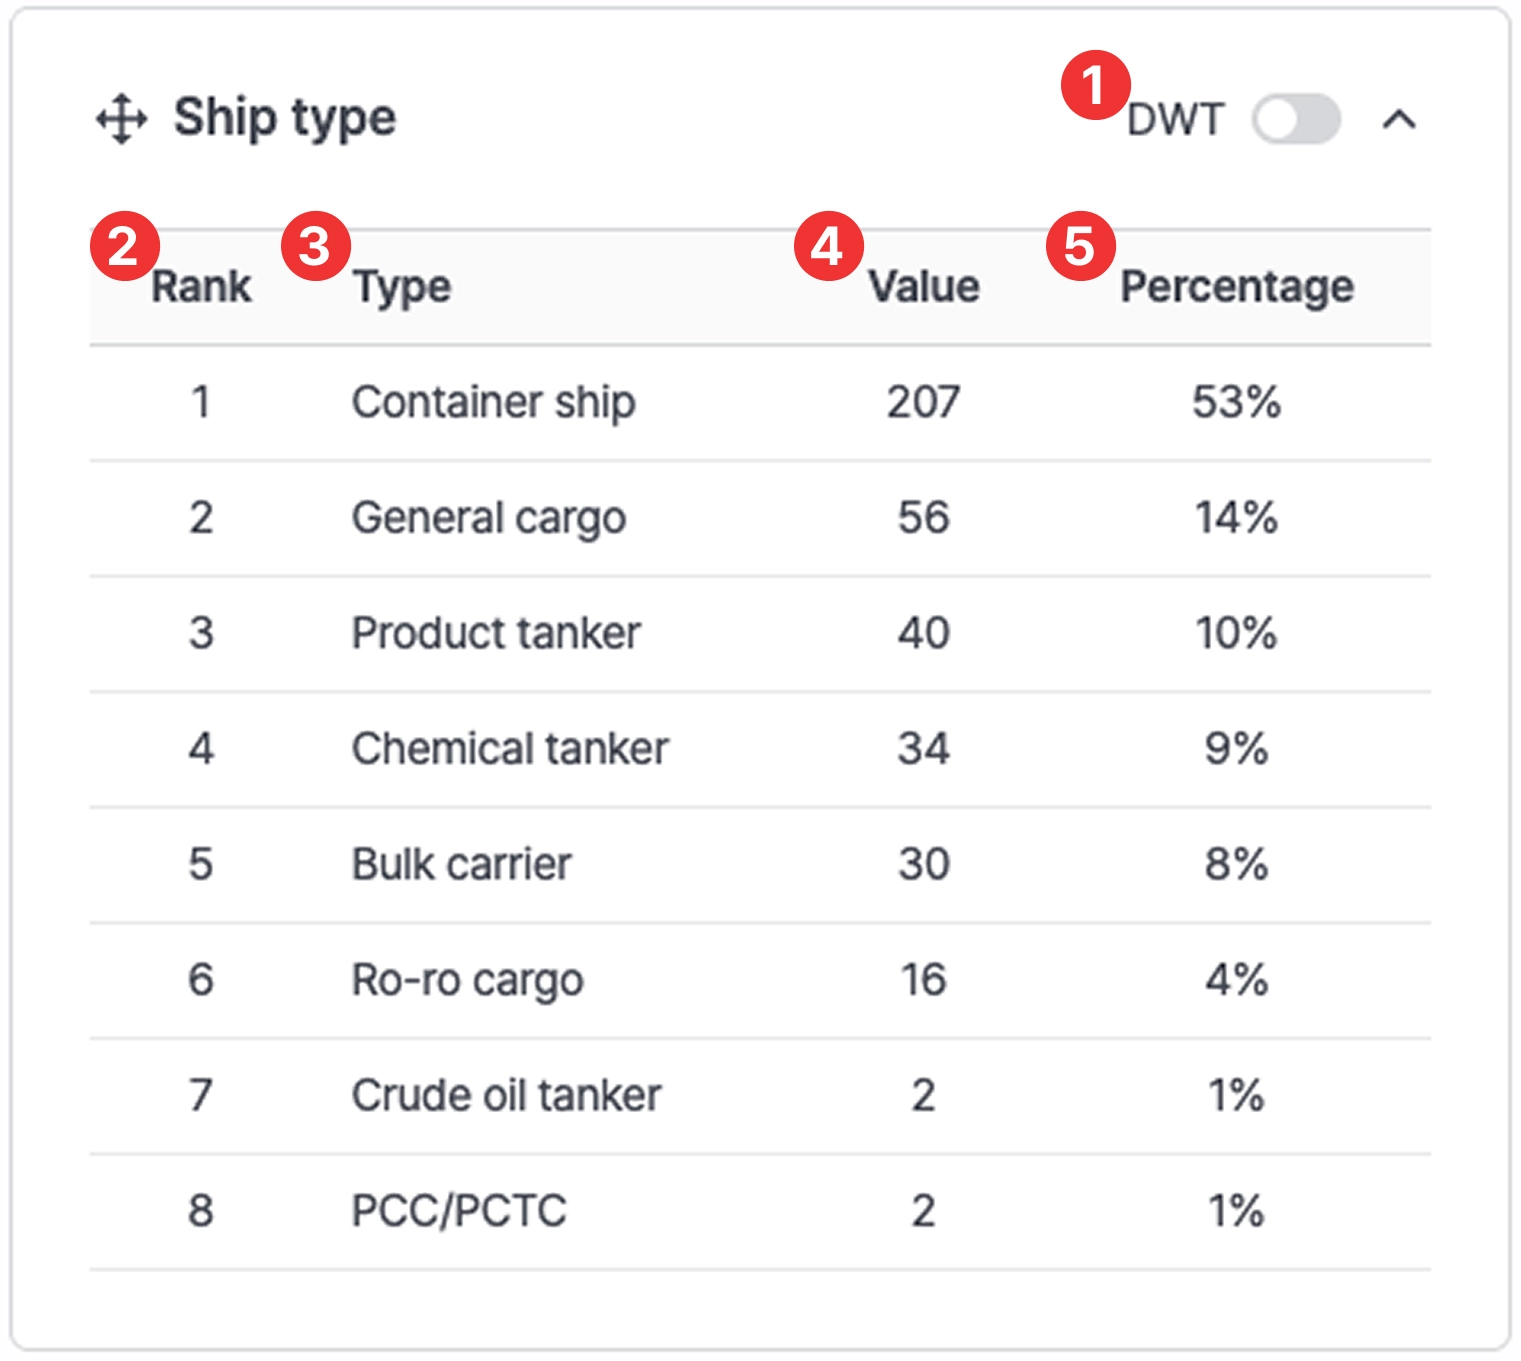
Port insight > Ship type
No. | Item | Description |
1 | DWT toggle button | When the toggle is OFF:
- Value: shows the number of vessels
- Percentage: shows the percentage based on vessel count
When the toggle is ON:
- Value: shows cargo volume (DWT)
- Percentage: shows the percentage based on cargo volume |
2 | Rank | Ranking order |
3 | Type | Ship type |
4 | Value | Number of vessels or cargo volume (DWT) |
5 | Percentage | Percentage by vessel count or cargo volume |
Real-time Port Operations Overview
Users can monitor real-time port congestion indicators and operational conditions for each port.
Congestion
•
Index: Shows the current congestion level compared to historical patterns for the selected port. Data updates every 15 minutes.
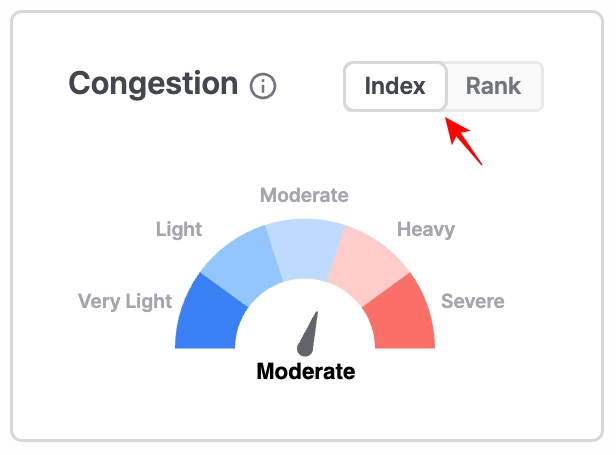
Port Insight > Congestion > Index
•
Rank: Displays how congested the selected port is relative to all ports supported in Port Insight. Data updates every 15 minutes.
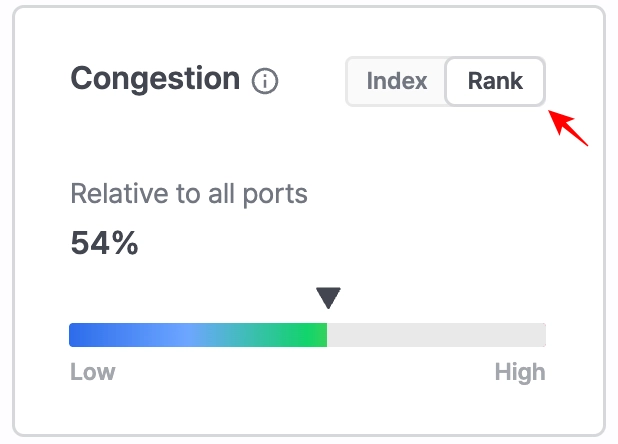
Port Insight > Congestion > Rank
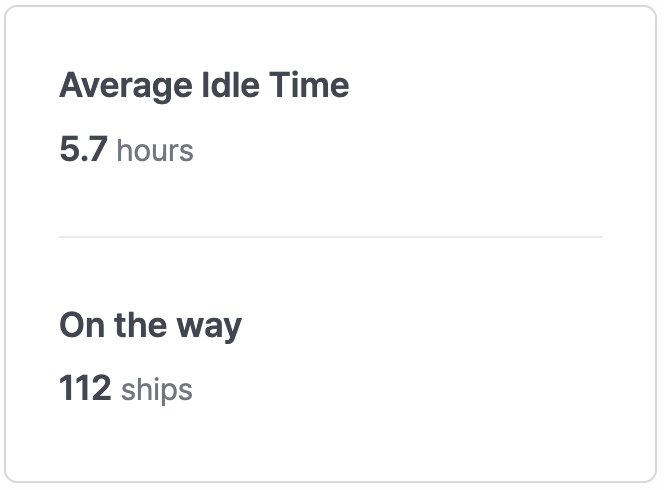
Average Idle Time / On the way
Port Insight > Average Idle Time / On the way
•
Average Idle Time: The average idle time of vessels currently en route to the port.
•
On the way: Number of vessels currently sailing toward the port.
•
Click the On the Way tab at the top to display the list of vessels currently en route to the selected port. For each vessel, you can review predicted arrival information, including ETA, PTA, and PTB.
•
Average Idle Time and On The Way data update every 15 minutes.
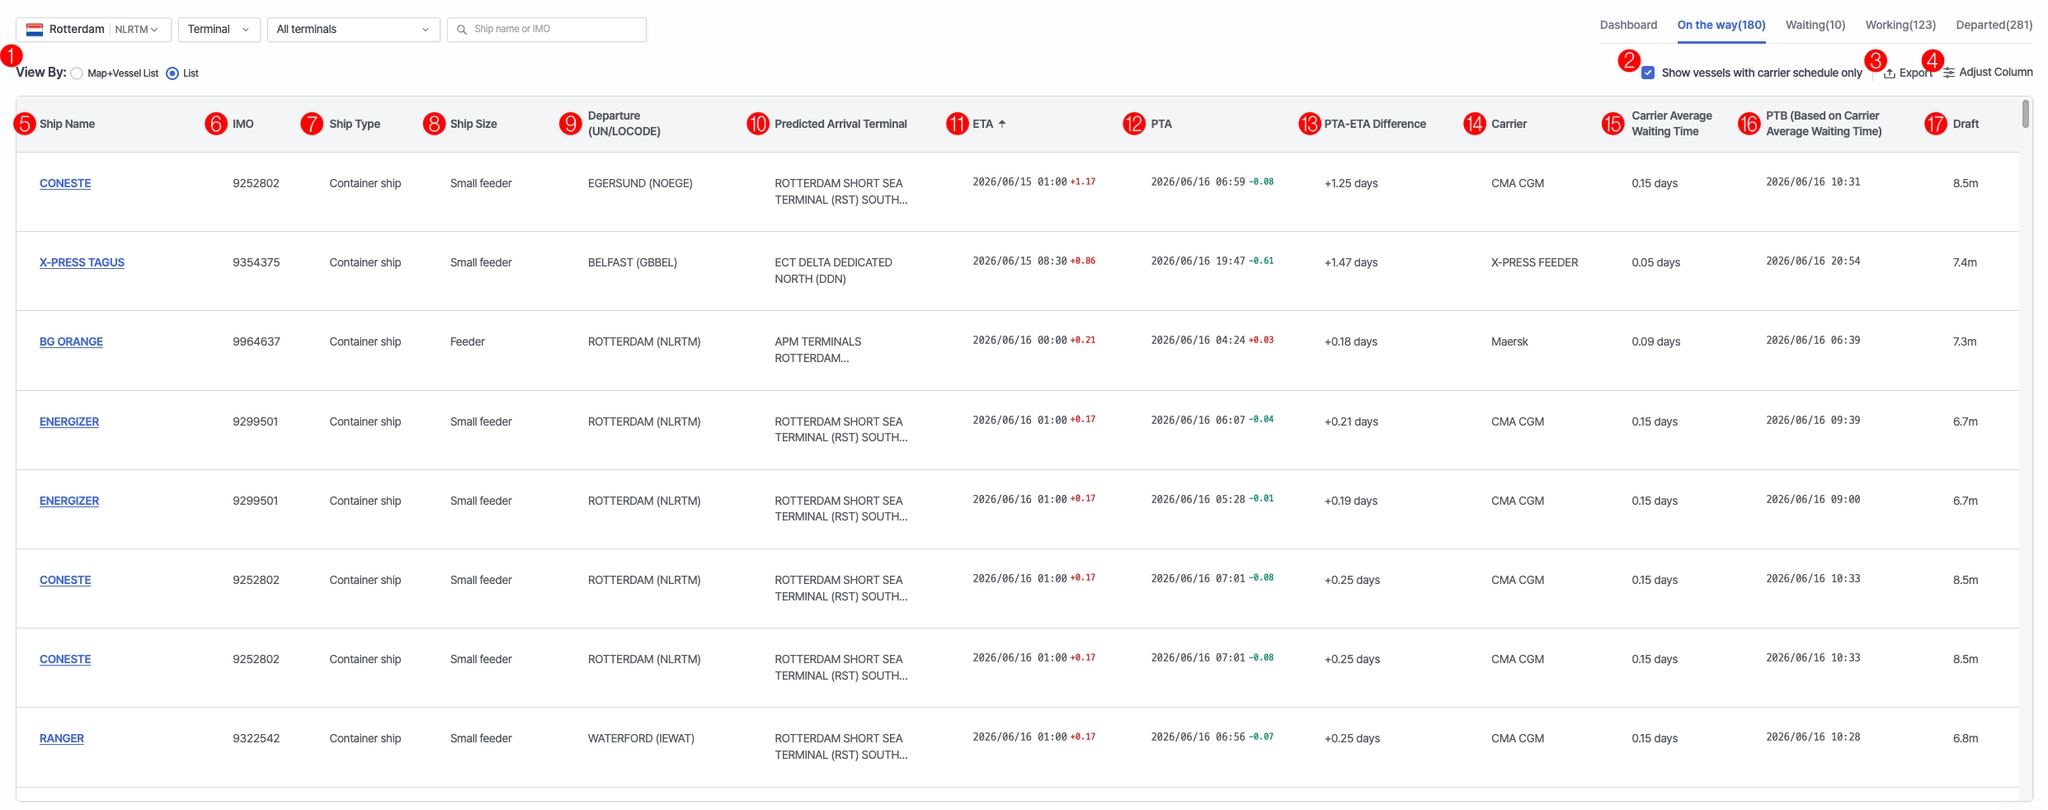
Port Insight > On the way
No. | Field | Description |
1 | View By | Select between Map+Vessel List or List view |
2 | Show vessels with carrier schedule only | Display only Waiting vessels analyzed based on carrier schedule data |
3 | Export | Download the vessel list |
4 | Adjust Column | Customize the columns displayed in the table |
5 | Ship Name | Vessel name |
6 | IMO | IMO number |
7 | Ship Type | Vessel type |
8 | Ship Size | Vessel size |
9 | Departure (UN/LOCODE) | Port of departure |
10 | Predicted Arrival Terminal | Predicted arrival terminal |
11 | ETA | Estimated time of arrival |
12 | PTA | Predicted time of arrival |
13 | PTA-ETA Difference | Time difference between PTA and ETA |
14 | Carrier | Carrier operating the vessel (displayed for schedule-based vessels only) |
15 | Carrier Average Waiting Time | Average waiting time based on the operating carrier (displayed for schedule-based vessels only) |
16 | PTB (Based on Carrier Average Waiting Time) | Predicted berthing time calculated based on the operating carrier’s average waiting time |
17 | Draft | Vessel draft |
Waiting
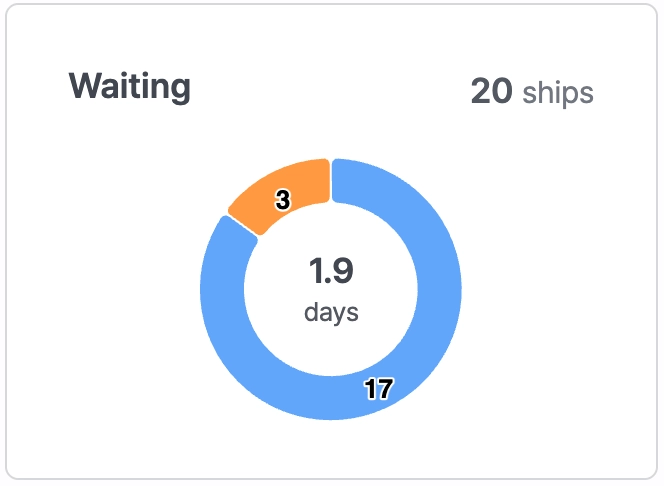
Port Insight > Waiting
•
Top value: Total number of vessels currently waiting.
•
Middle value: Average waiting days of vessels currently in queue.
•
Blue range: Vessels within the normal waiting range.
•
Orange range: Vessels experiencing delays beyond the normal waiting range.
•
Click the Waiting tab at the top to display the list of vessels currently waiting at the port. For each vessel, you can review detailed berthing information (PTB) and arrival information (ATA).
•
Data is updated every 15 minutes.
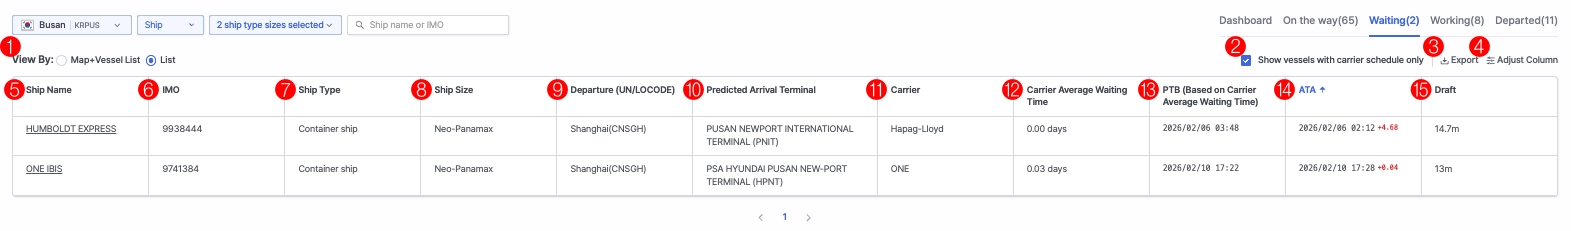
No. | Field | Description |
1 | View By | Select between Map+Vessel List or List view |
2 | Show vessels with carrier schedule only | Display only Waiting vessels analyzed based on carrier schedule data |
3 | Export | Download the vessel list |
4 | Adjust Column | Customize the columns displayed in the table |
5 | Ship Name | Vessel name |
6 | IMO | IMO number |
7 | Ship Type | Vessel type |
8 | Ship Size | Vessel size |
9 | Departure (UN/LOCODE) | Port of departure |
10 | Predicted Arrival Terminal | Predicted arrival terminal |
11 | Carrier | Carrier operating the vessel (displayed for schedule-based vessels only) |
12 | Carrier Average Waiting Time | Average waiting time based on the operating carrier (displayed for schedule-based vessels only) |
13 | PTB (Based on Carrier Average Waiting Time) | Predicted berthing time calculated based on the operating carrier’s average waiting time |
14 | ATA | Actual arrival time, including waiting duration |
15 | Draft | Vessel draft |
Working
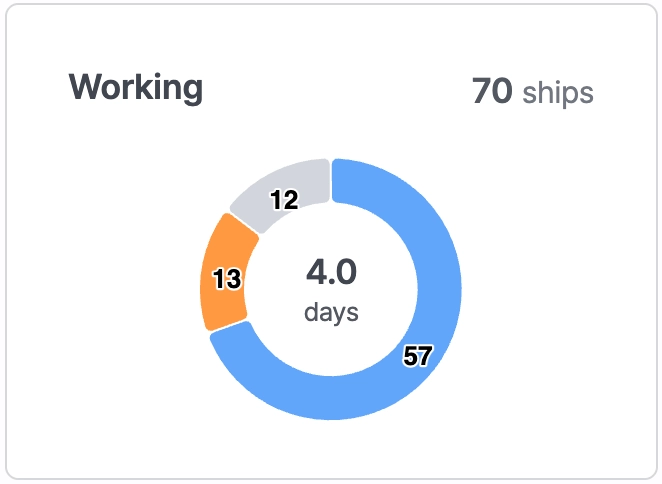
Port Insight > Working
•
Top value: Number of vessels currently berthed.
•
Middle value: Average working days of vessels currently berthed.
•
Blue range: Normal working time range.
•
Orange range: Delayed vessels based on average working time.
•
Gray range: Vessels berthed at shipyards.
•
Clicking the Working tab displays the full list of berthed vessels with ATA/ATB details.
•
Data updates every 15 minutes.
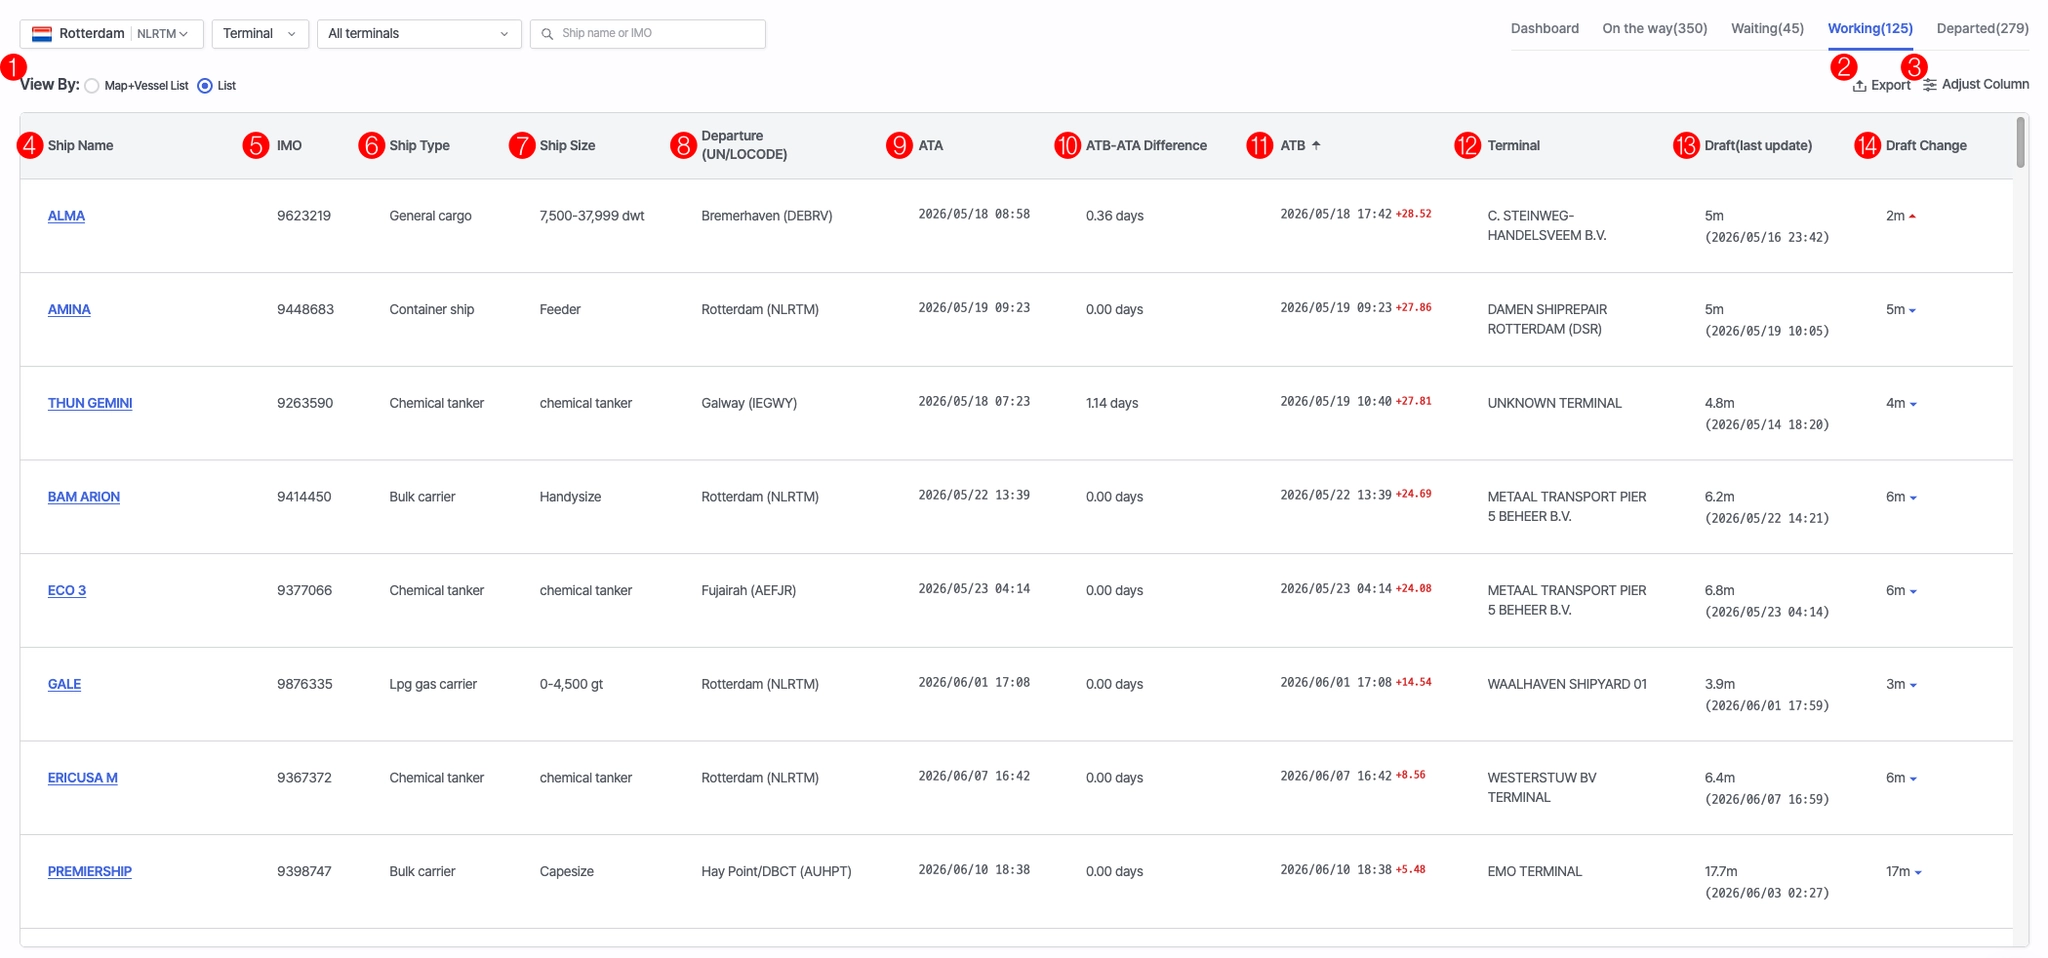
Port Insight > Working
No. | Field | Description |
1 | View By | Select between Map+Vessel List or List view |
2 | Export | Download the vessel list |
3 | Adjust Column | Customize the columns displayed in the table |
4 | Ship Name | Vessel name. |
5 | IMO | IMO number |
6 | Ship Type | Vessel type |
7 | Ship Size | Vessel size |
8 | Departure (UN/LOCODE) | Port of departure |
9 | ATA | Actual Time of Arrival |
10 | ATB - ATA Difference | Time difference between ATB and ATA |
11 | ATB | Actual Time of Berthing |
12 | Terminal | Name of the arrival terminal |
13 | Draft(last update) | Vessel draft (last updated time) |
14 | Draft Change | Increase or decrease in vessel draft |
Departed
•
Clicking the Departed tab displays vessels that have completed departure, including ATA, ATB, and ATD information.
•
Data updates every 15 minutes.
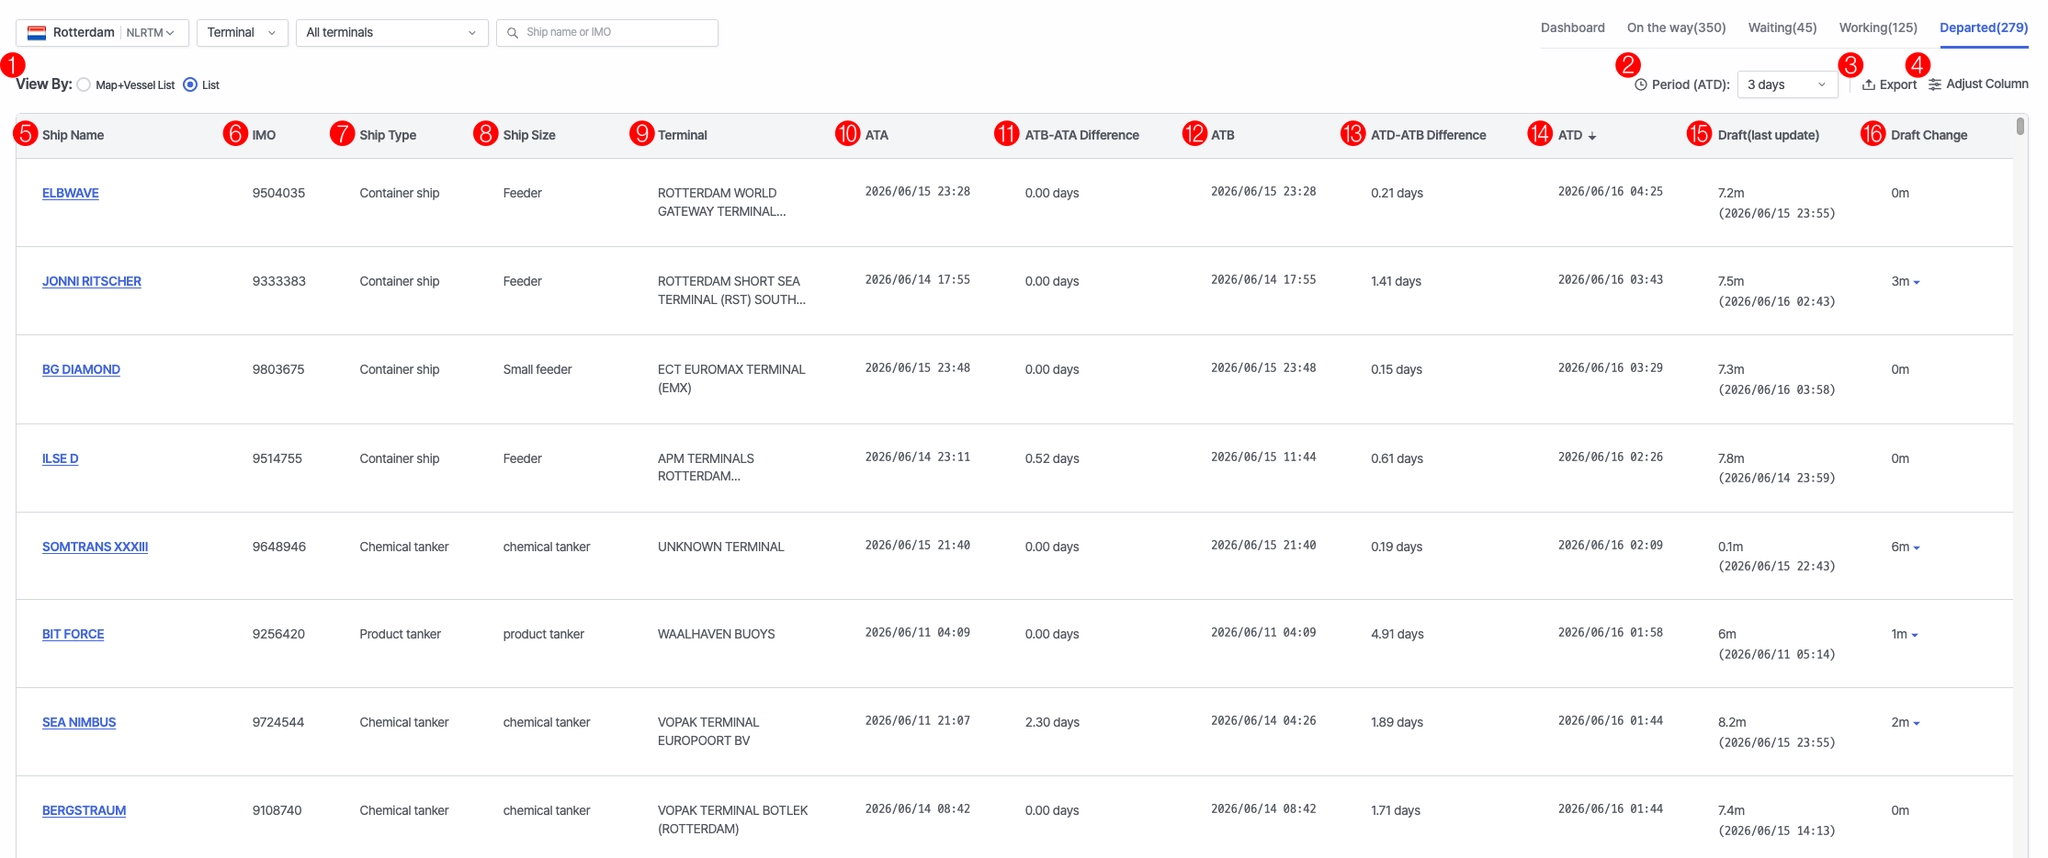
Port Insight > Departed
No. | Field | Description |
1 | View By | Select between Map+Vessel List or List view |
2 | Period (ATD) | Select ATD time range |
3 | Export | Download the vessel list |
4 | Adjust Column | Customize the columns displayed in the table |
5 | Ship Name | Vessel name |
6 | IMO | IMO number |
7 | Ship Type | Vessel type |
8 | Ship Size | Vessel size |
9 | Terminal | Terminal name |
10 | ATA | Actual arrival time |
11 | ATB-ATA Difference | Time difference between ATB and ATA |
12 | ATB | Actual berthing time |
13 | ATD-ATB Difference | Time difference between ATD and ATB |
14 | ATD | Actual departure time |
15 | Draft(last update) | Latest draft value |
16 | Draft Change | Increase/decrease in draft |
Congestion Index Trend
Index Trend
•
Displays congestion levels scaled from 1 to 10, based on the current congestion compared to long-term average conditions. Higher values indicate heavier congestion.
•
Data updates every 4 hours.
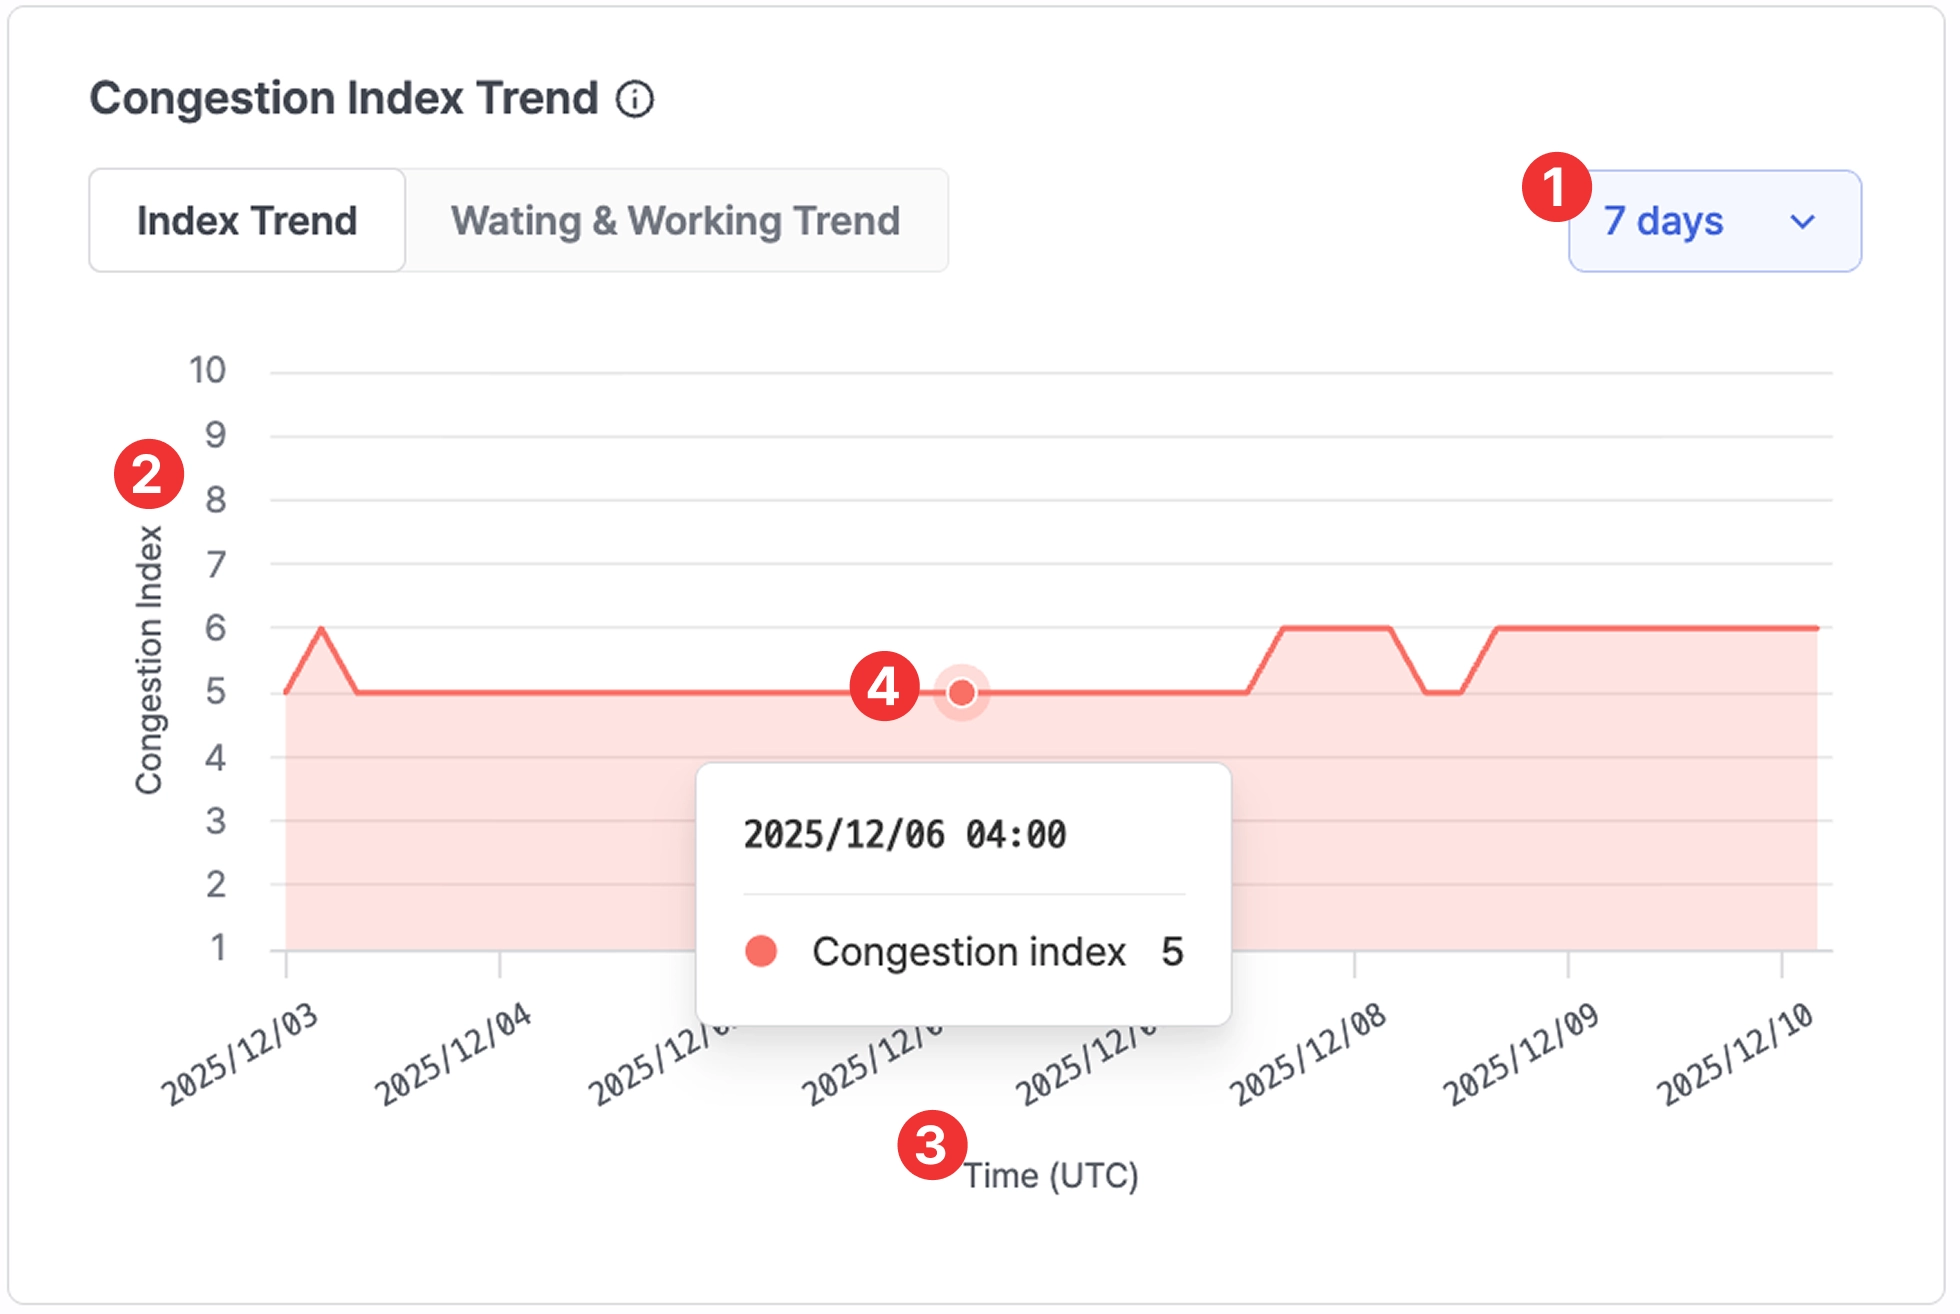
Port insight > Congestion Index Trend > Index Trend 7-day view
No. | Field | Description |
1 | Period selection | Select period from the dropdown |
2 | Congestion index | Numerical range representing the congestion index
(Refer to the table below) |
3 | Time (UTC) | Timestamp |
4 | Value on hover | Hover over the chart to view exact values |
*Congestion Index Score
Range | Level | Description |
1–2 | Very Light | No delay or extremely smooth operations |
3–4 | Light | Better-than-average conditions |
5–6 | Moderate | Normal operations with minor waiting possible |
7–8 | Heavy | Increased waiting times or operational delays |
9–10 | Severe | Significant delays; port operating at near-capacity |
Waiting & Working Trend
•
Shows the average number of vessels and days spent waiting or working at the port.
•
Periods of 7, 30, 60, 90 days can be selected from the filter on the upper right.
•
Data updates every 4 hours.
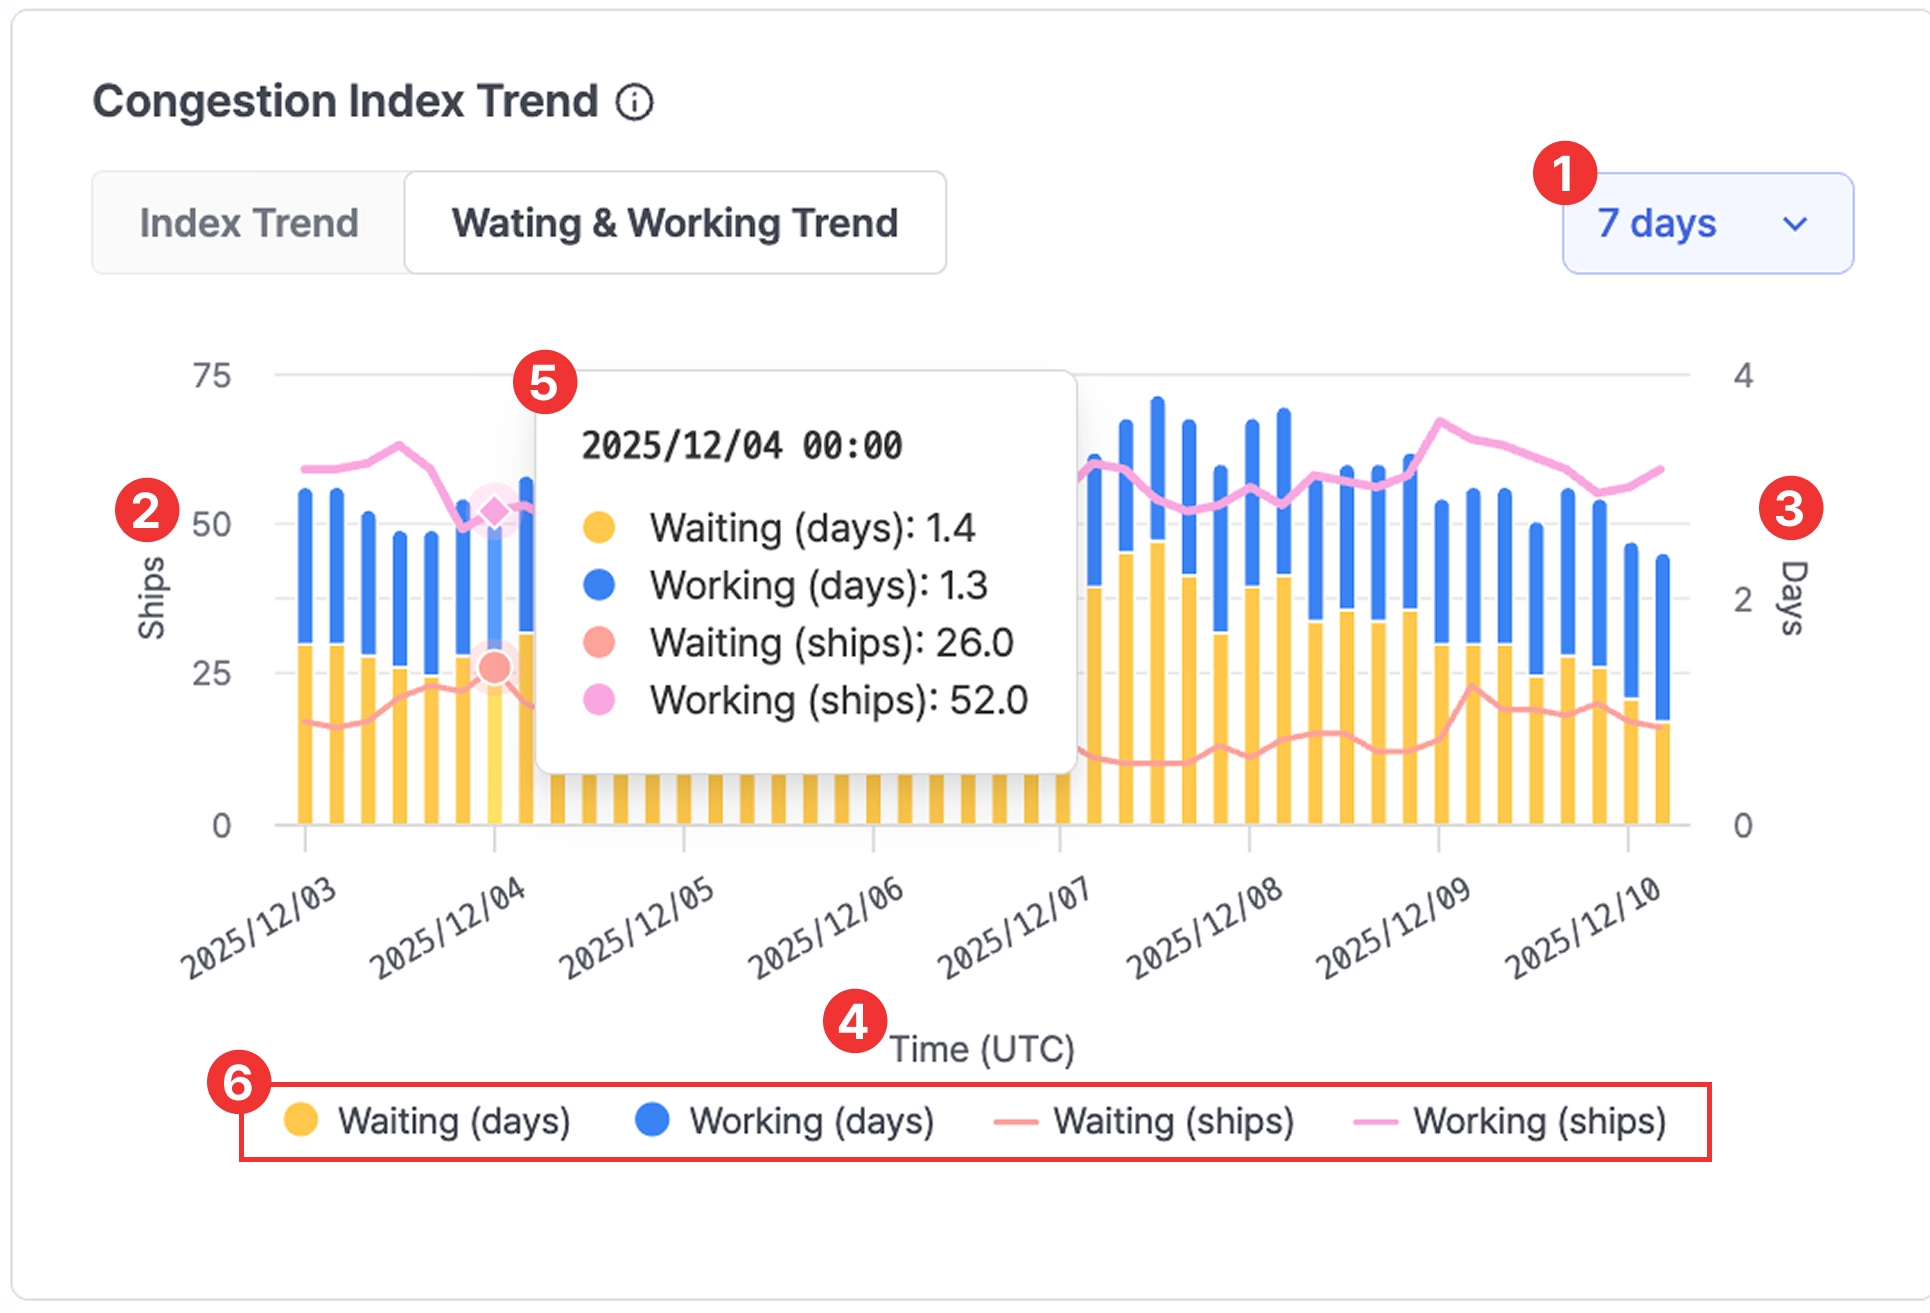
Port insight > Congestion Index Trend > Waiting & Working Trend 7-day view
No. | Field | Description |
1 | Period selection | Select viewing period |
2 | Ships | Waiting/working vessel counts |
3 | Days | Waiting/working days |
4 | Time | Timestamp |
5 | Value on hover | Hover to view exact values |
6 | Legend | Click the legend buttons to show or hide specific metrics on the chart.
- Waiting (days)
- Working (days)
- Waiting (ships)
- Working (ships) |
Statistics
Users can review vessel statistics over a selected period based on the entire port, individual terminals, or ship types.
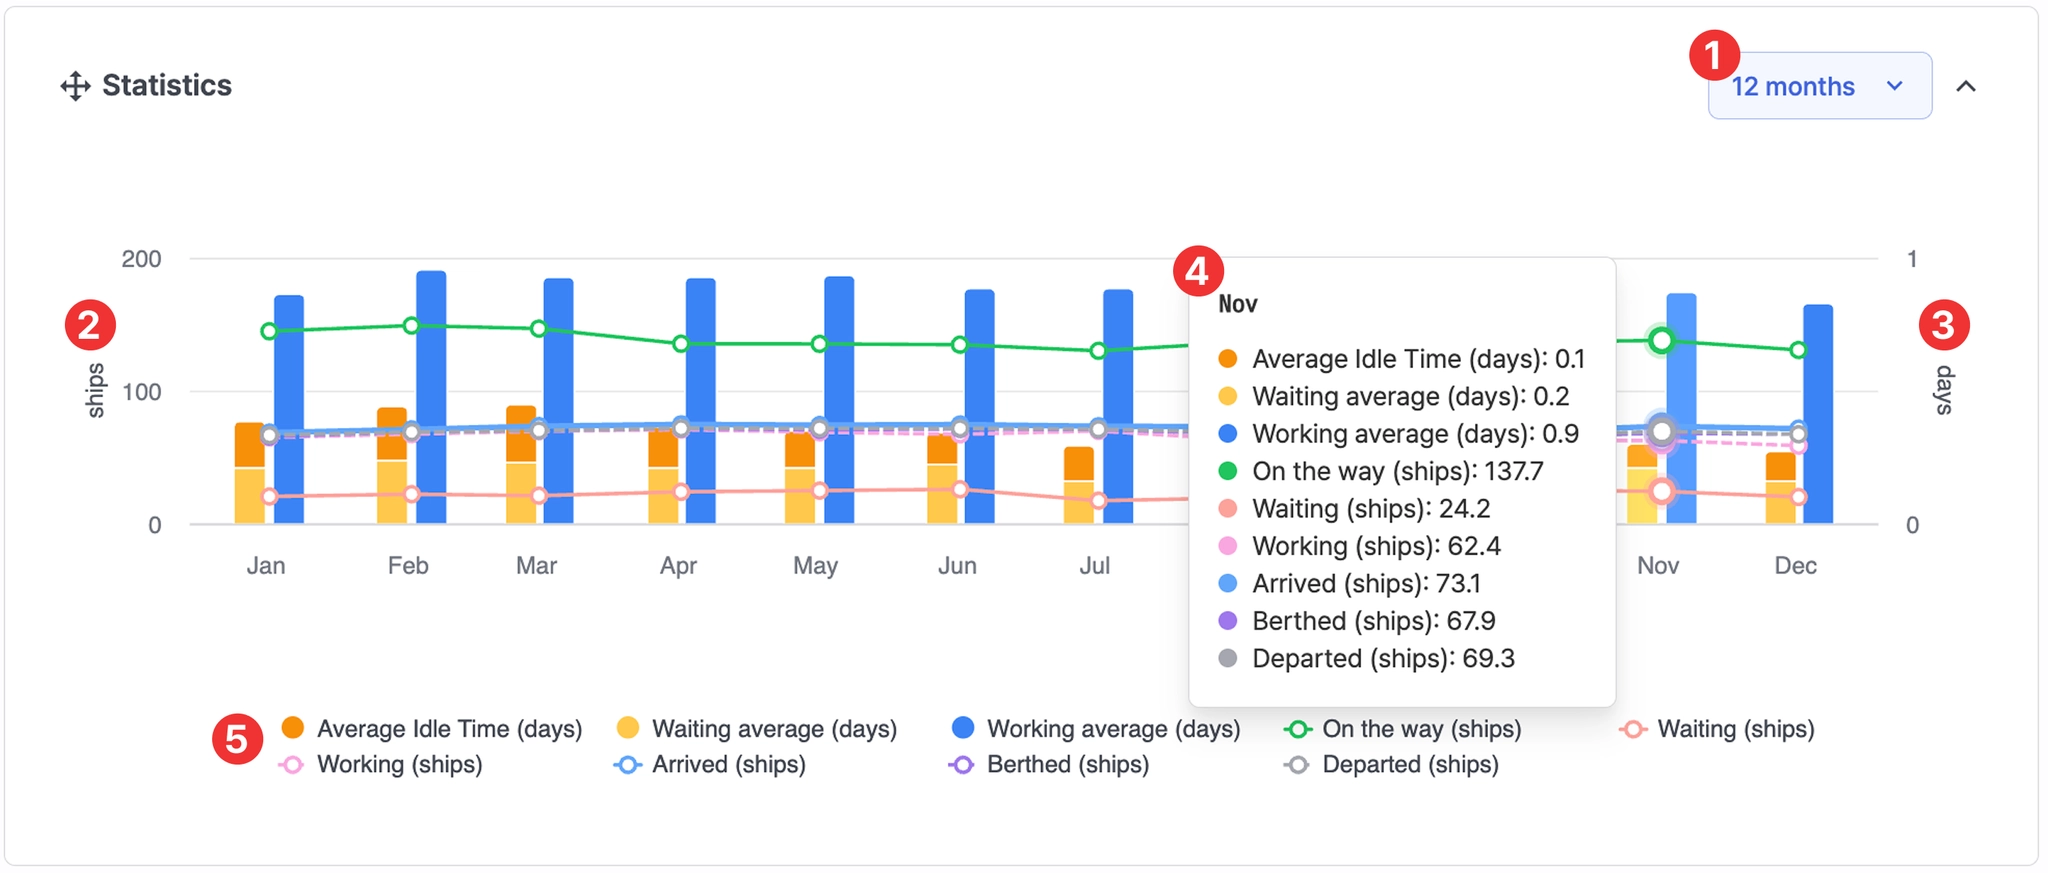
Port insight > Statistics 12 months view
No. | Item | Description |
1 | Period selection | Set the analysis period by day, month, or custom range. |
2 | ships | Number of vessels. |
3 | days | Number of days. |
4 | Detailed value display | Hover over the chart to view detailed values for the selected point in time. |
5 | Legend | Click legend items to show or hide specific metrics on the chart:
- Average Idle Time (days): Average idle days for vessels currently en route to the port
- Waiting average (days): Average waiting days
- Working average (days): Average working (berthing) days
- On the way (ships): Number of vessels currently en route to the port
- Waiting (ships): Number of waiting vessels
- Working (ships): Number of working (berthed) vessels
- Arrived (ships): Number of arrived vessels
- Berthed (ships): Number of berthed vessels
- Departed (ships): Number of departed vessels |
Previous Calling Ports
Users can view DWT and vessel count statistics for previous ports of call based on the selected port or terminal.
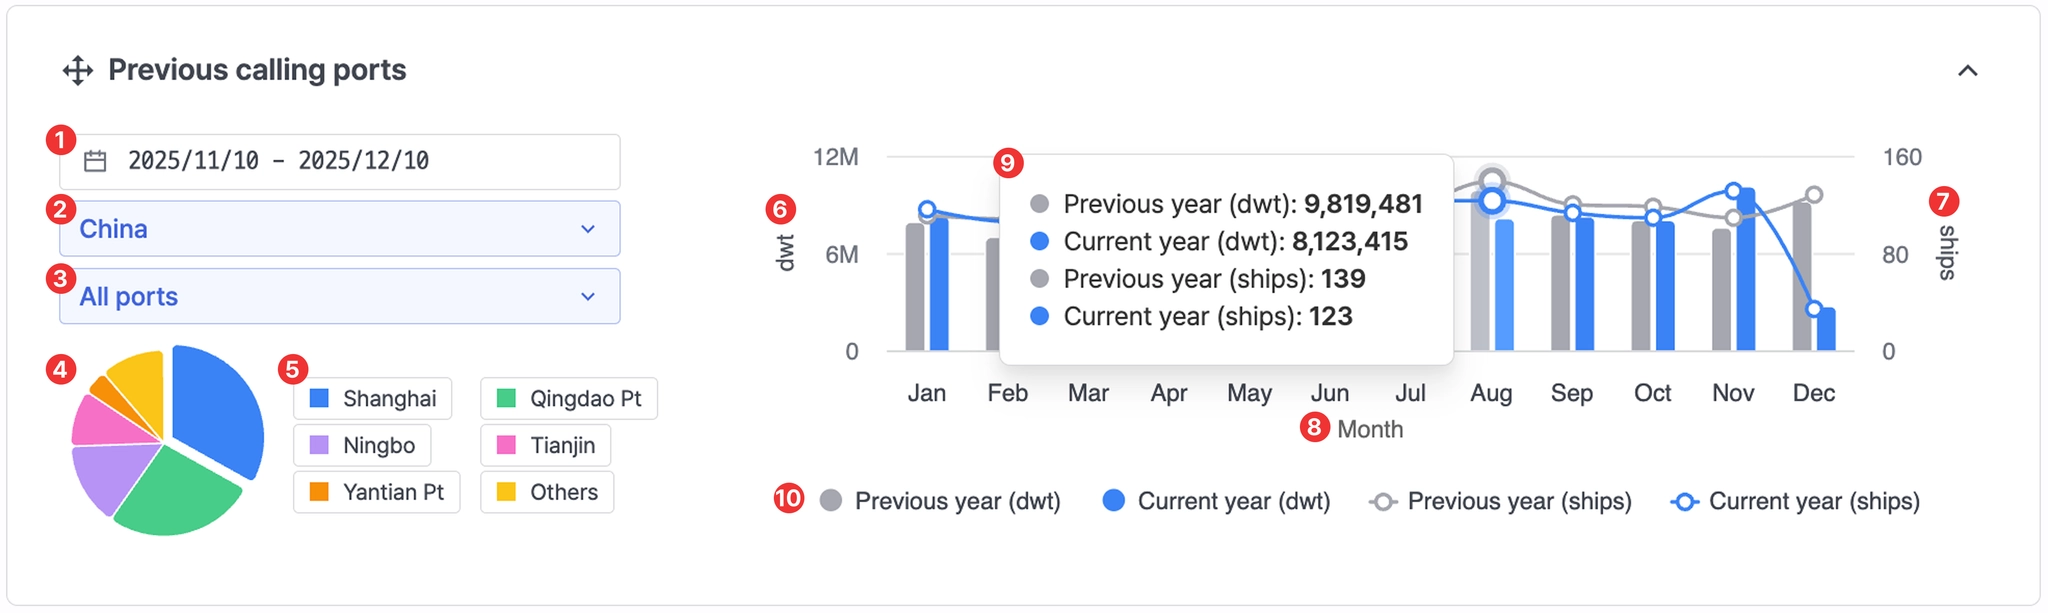
Port insight > Previous Calling Ports showing all ports in China
No. | Item | Description |
1 | Period | Set the analysis period |
2 | All nations | Select a country |
3 | All ports | After selecting a country, choose a specific port |
4 | Chart | - Displays cargo volume (DWT) by country, port, or terminal
- Clicking any pie segment shows the corresponding DWT value for that country, port, or terminal |
5 | Chart legend | Click legend items to show or hide specific countries, ports, or terminals in the chart |
6 | dwt | Cargo volume (Deadweight tonnage) |
7 | ships | Number of vessels |
8 | Month | Month |
9 | Value details | Hover over the graph to view detailed values for the selected point in time |
10 | Legend | Click legend items to display only relevant metrics:
- Previous year (dwt): last year’s cargo volume
- Current year (dwt): this year’s cargo volume
- Previous year (ships): last year’s vessel count
- Current year (ships): this year’s vessel count |
Next Calling Ports
Users can view cargo volume (DWT) and vessel count statistics for next calling ports based on the selected port or terminal.
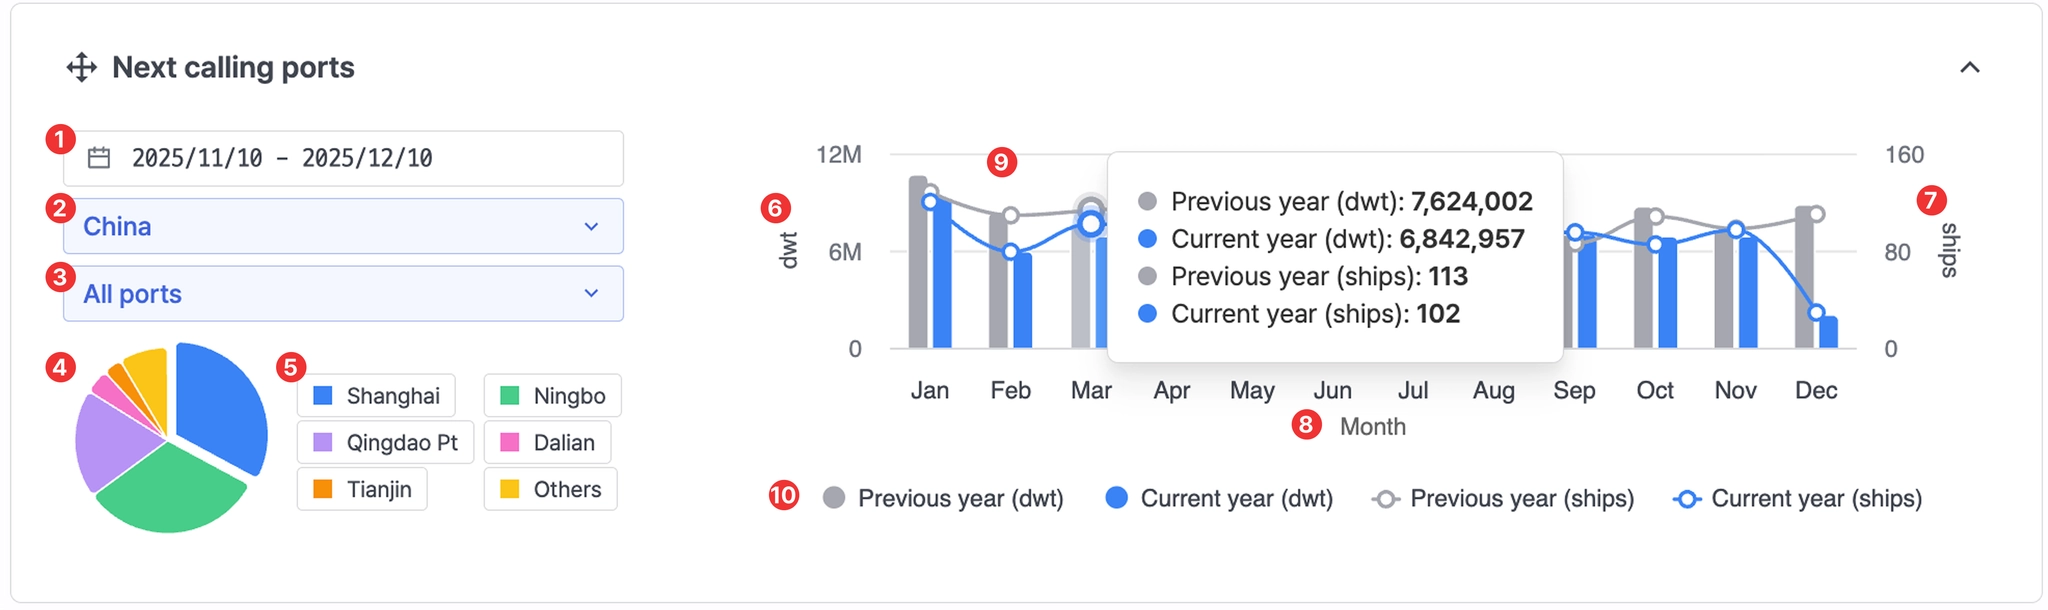
Port insight > Next Calling Ports showing all ports in China
No. | Item | Description |
1 | Period | Set the analysis period |
2 | All nations | Select a country |
3 | All ports | After selecting a country, choose a specific port |
4 | Chart | - Displays cargo volume (DWT) by country, port, or terminal
- Clicking a pie segment shows the corresponding DWT value for that country, port, or terminal |
5 | Chart legend | Click legend items to show or hide specific countries, ports, or terminals in the chart |
6 | dwt | Cargo volume (Deadweight tonnage) |
7 | ships | Number of vessels |
8 | Month | Month |
9 | Value details | Hover over the graph to view detailed values for the selected point in time |
10 | Legend | Click legend items to display only selected metrics:
- Previous year (dwt): last year’s cargo volume
- Current year (dwt): this year’s cargo volume
- Previous year (ships): last year’s vessel count
- Current year (ships): this year’s vessel count |
.png&blockId=36e4a58b-3010-8031-acee-cc998e52720b)