



This screen allows you to view a shipment’s entire voyage route, current vessel position, port call information, and container events in real time.
Summary Information
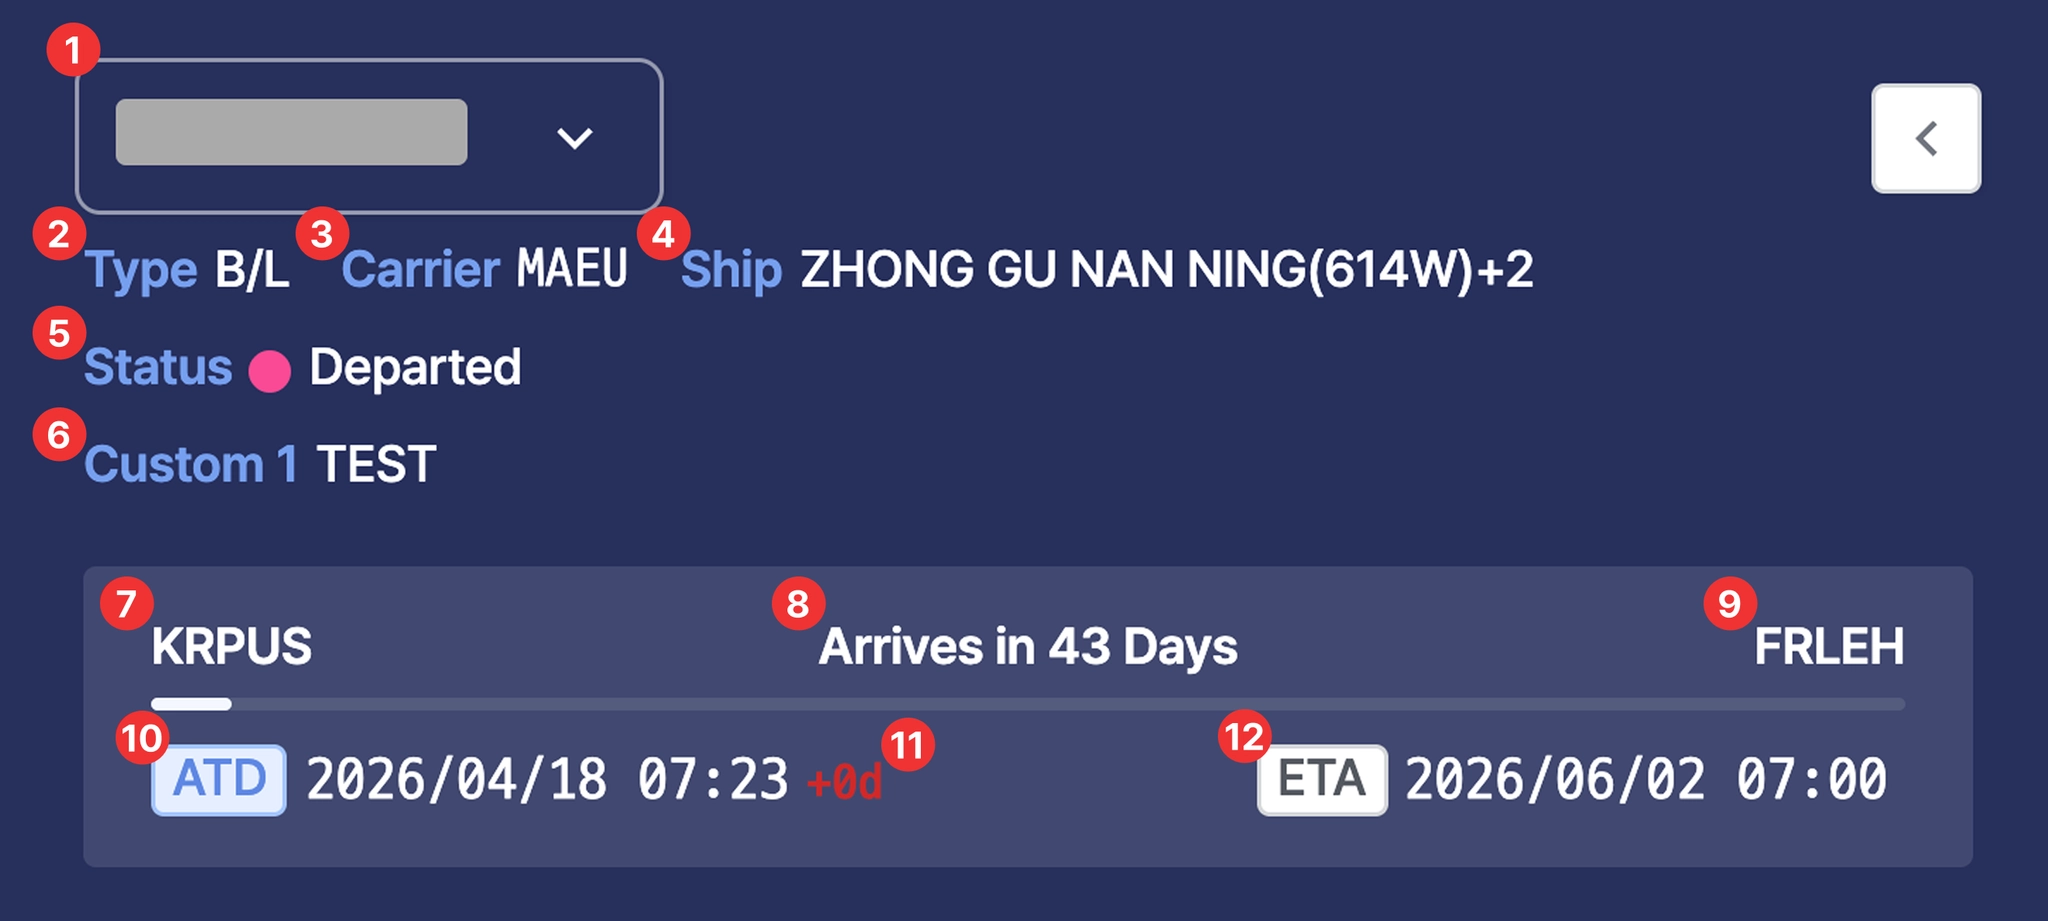
Cargo Insight Shipment Detail View > Summary
No. | Description |
1 | Shipment number (one of M-B/L No., Booking No., or Container No.)
- Dropdown: Displays the list of shared shipment numbers when multiple shipments are shared |
2 | Shipment identification type (M-B/L, Booking, or Container) |
3 | Carrier code |
4 | Vessel information |
5 | Current shipment status:
- Ready to Depart: The vessel has not yet departed from the Port of Loading (POL)
- Departed: The vessel has departed from the Port of Loading (POL)
- Arrived: The vessel has arrived at the Port of Discharge (POD) |
6 | Custom fields |
7 | Port of Loading (POL) |
8 | Remaining days until arrival or number of delayed days |
9 | Port of Discharge (POD) |
10 | Estimated and actual departure dates
(ETD : Estimated Time of Departure / ATD : Actual Time of Departure) |
11 | Schedule difference between the shipment registration time and the current time |
12 | Estimated and actual arrival dates
(ETA : Estimated Time of Arrival / ATA : Actual Time of Arrival) |
Location
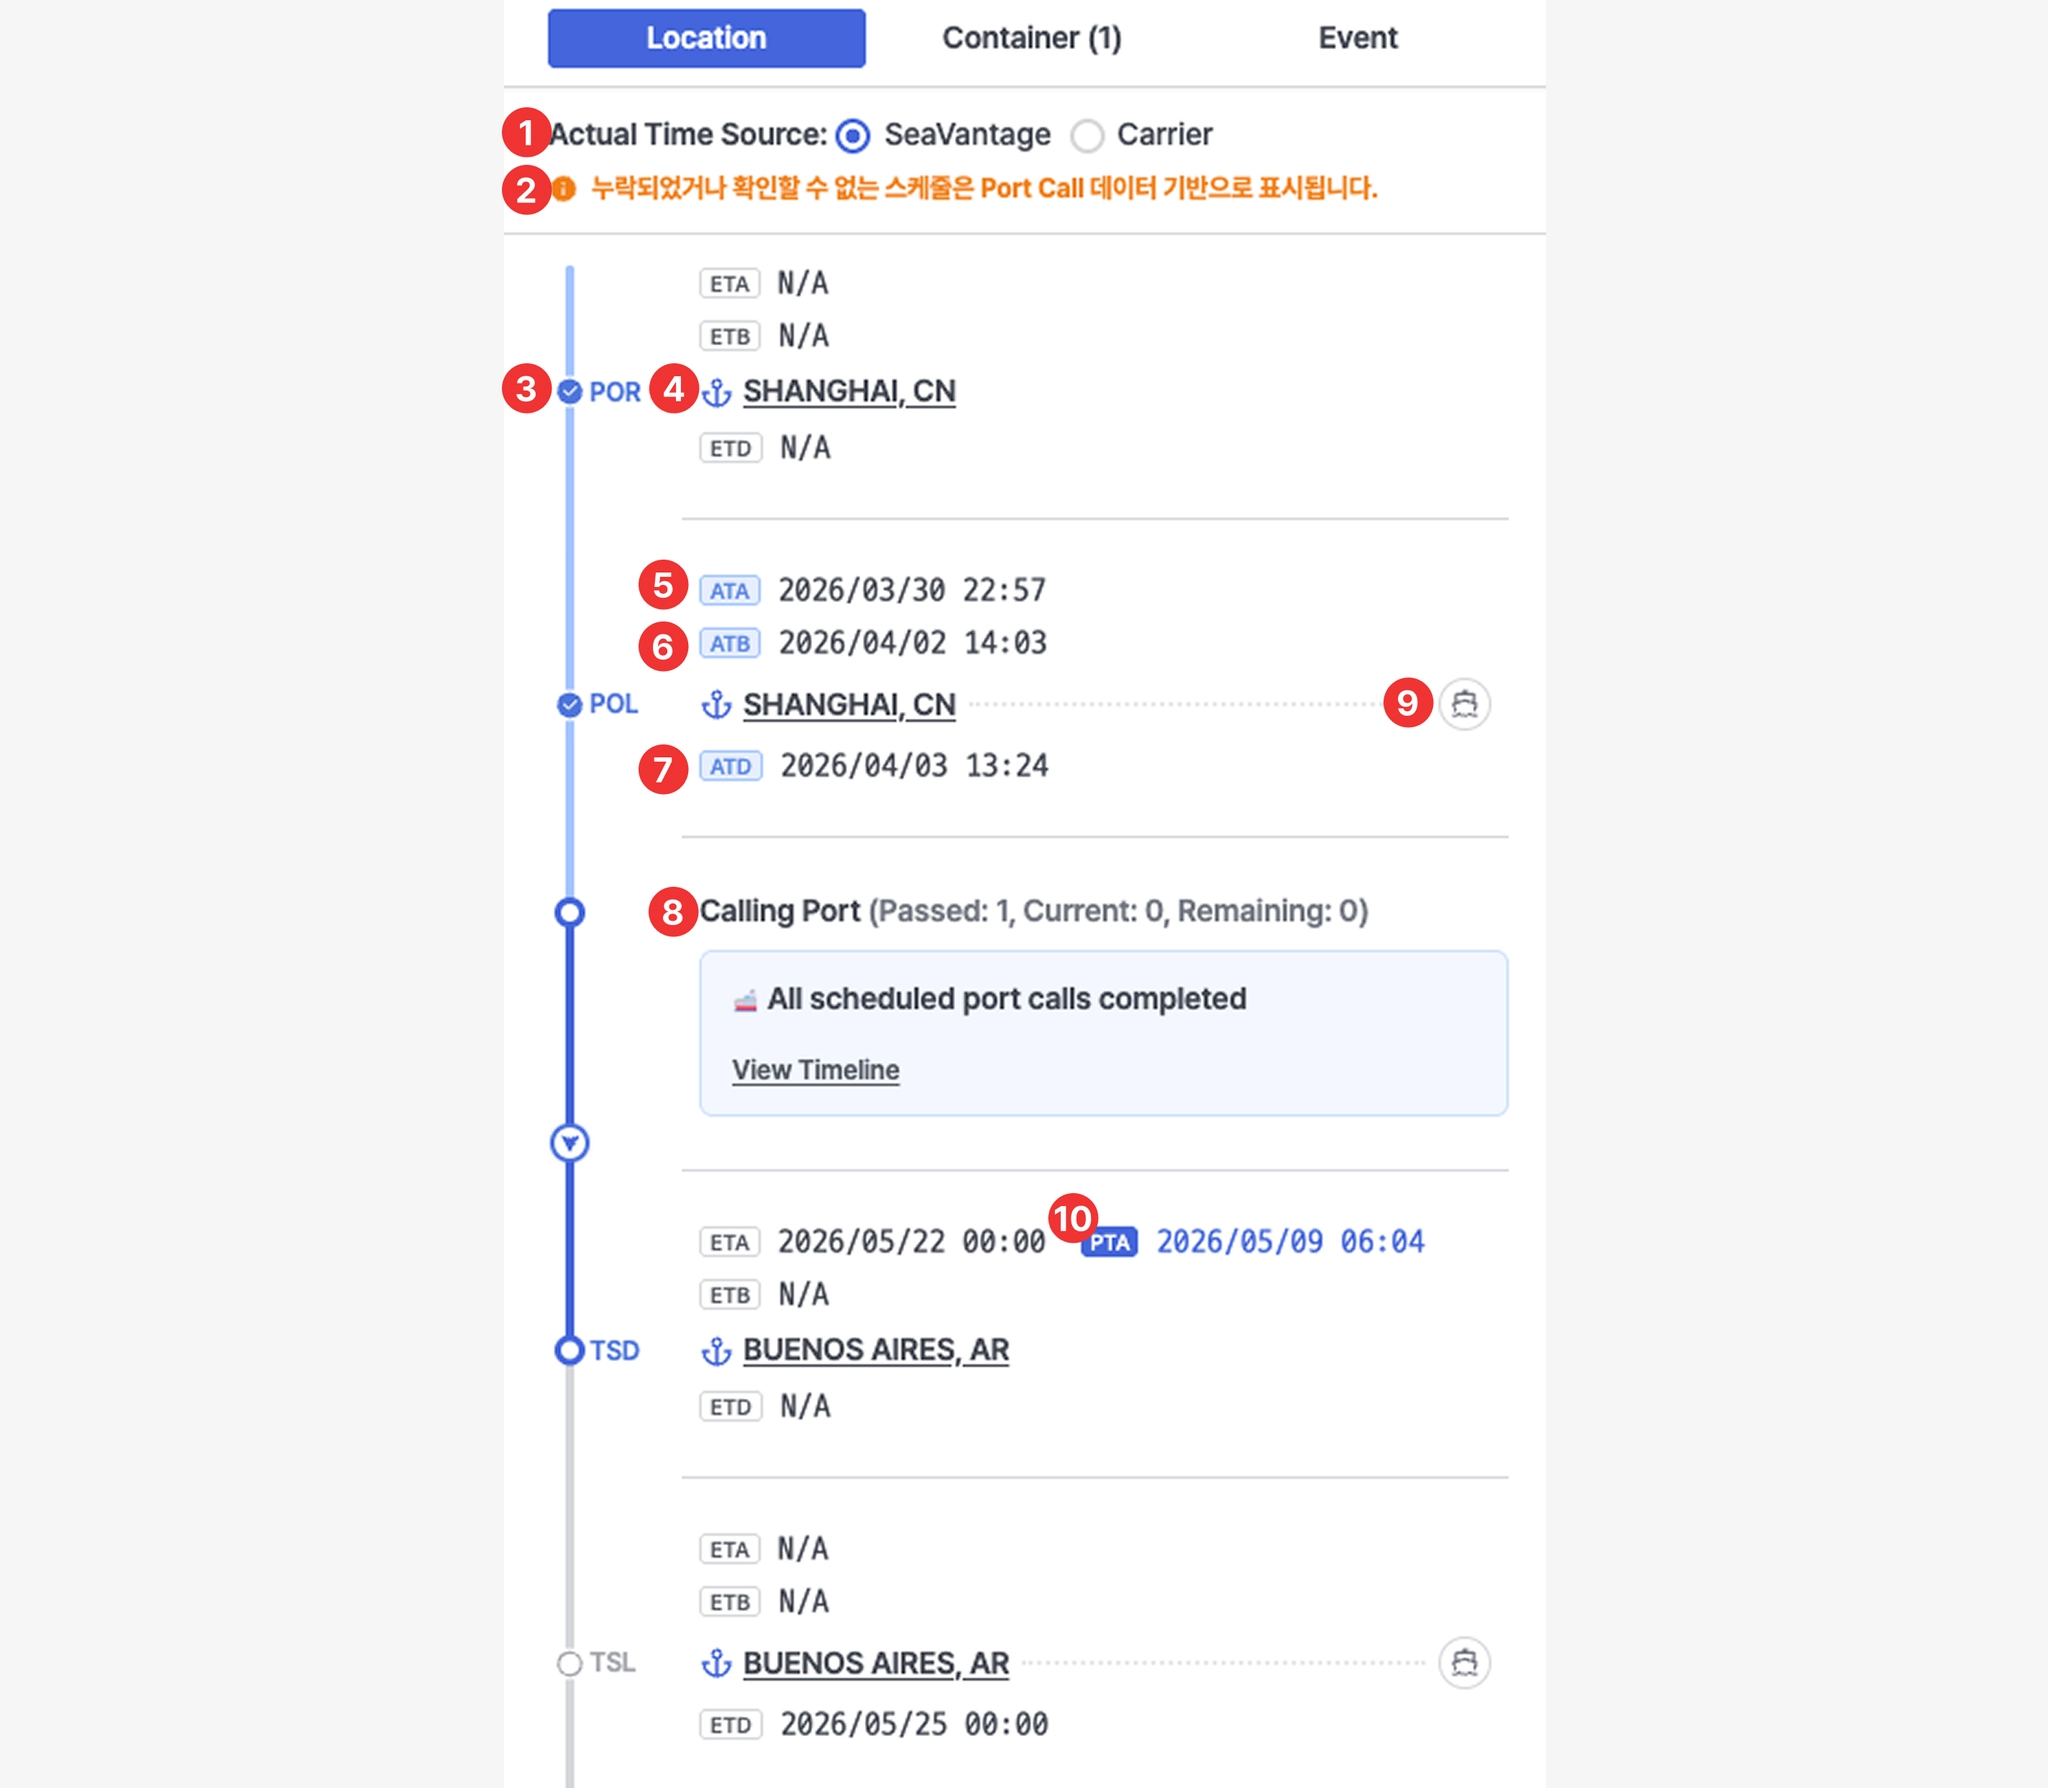
Cargo Insight > Shipment Detail View > Location
No. | Description |
1 | Actual Time Source
- SeaVantage : Actual Time generated based on SeaVantage port call data
- Carrier : Actual Time collected directly from the carrier |
2 | An alert indicator is displayed when the data is provided based on port call data collected by SeaVantage |
3 | Location Type
- POR: Place of Receipt
- POL: Port of Loading
- TSD: Transshipment Discharging
- TSL: Transshipment Loading
- POD: Port of Discharging
- PVY: Place of Delivery |
4 | Port name
- Clicking the port name displays the port location and area on the map |
5 | Estimated and actual arrival dates
(ETA : Estimated Time of Arrival / ATA : Actual Time of Arrival) |
6 | Estimated and actual berthing dates
(ETB : Estimated Time of Berthing / ATB : Actual Time of Berthing) |
7 | Estimated and actual departure dates
(ETD : Estimated Time of Departure / ATD : Actual Time of Departure) |
8 | Predicted arrival date
(PTA : Predicted Time of Arrival) |
9 | Intermediate port call information for the vessel
- Click View Timeline to see detailed port call information |
10 | Clicking the vessel icon displays the vessel’s real-time position on the map |
Container
1. Carrier
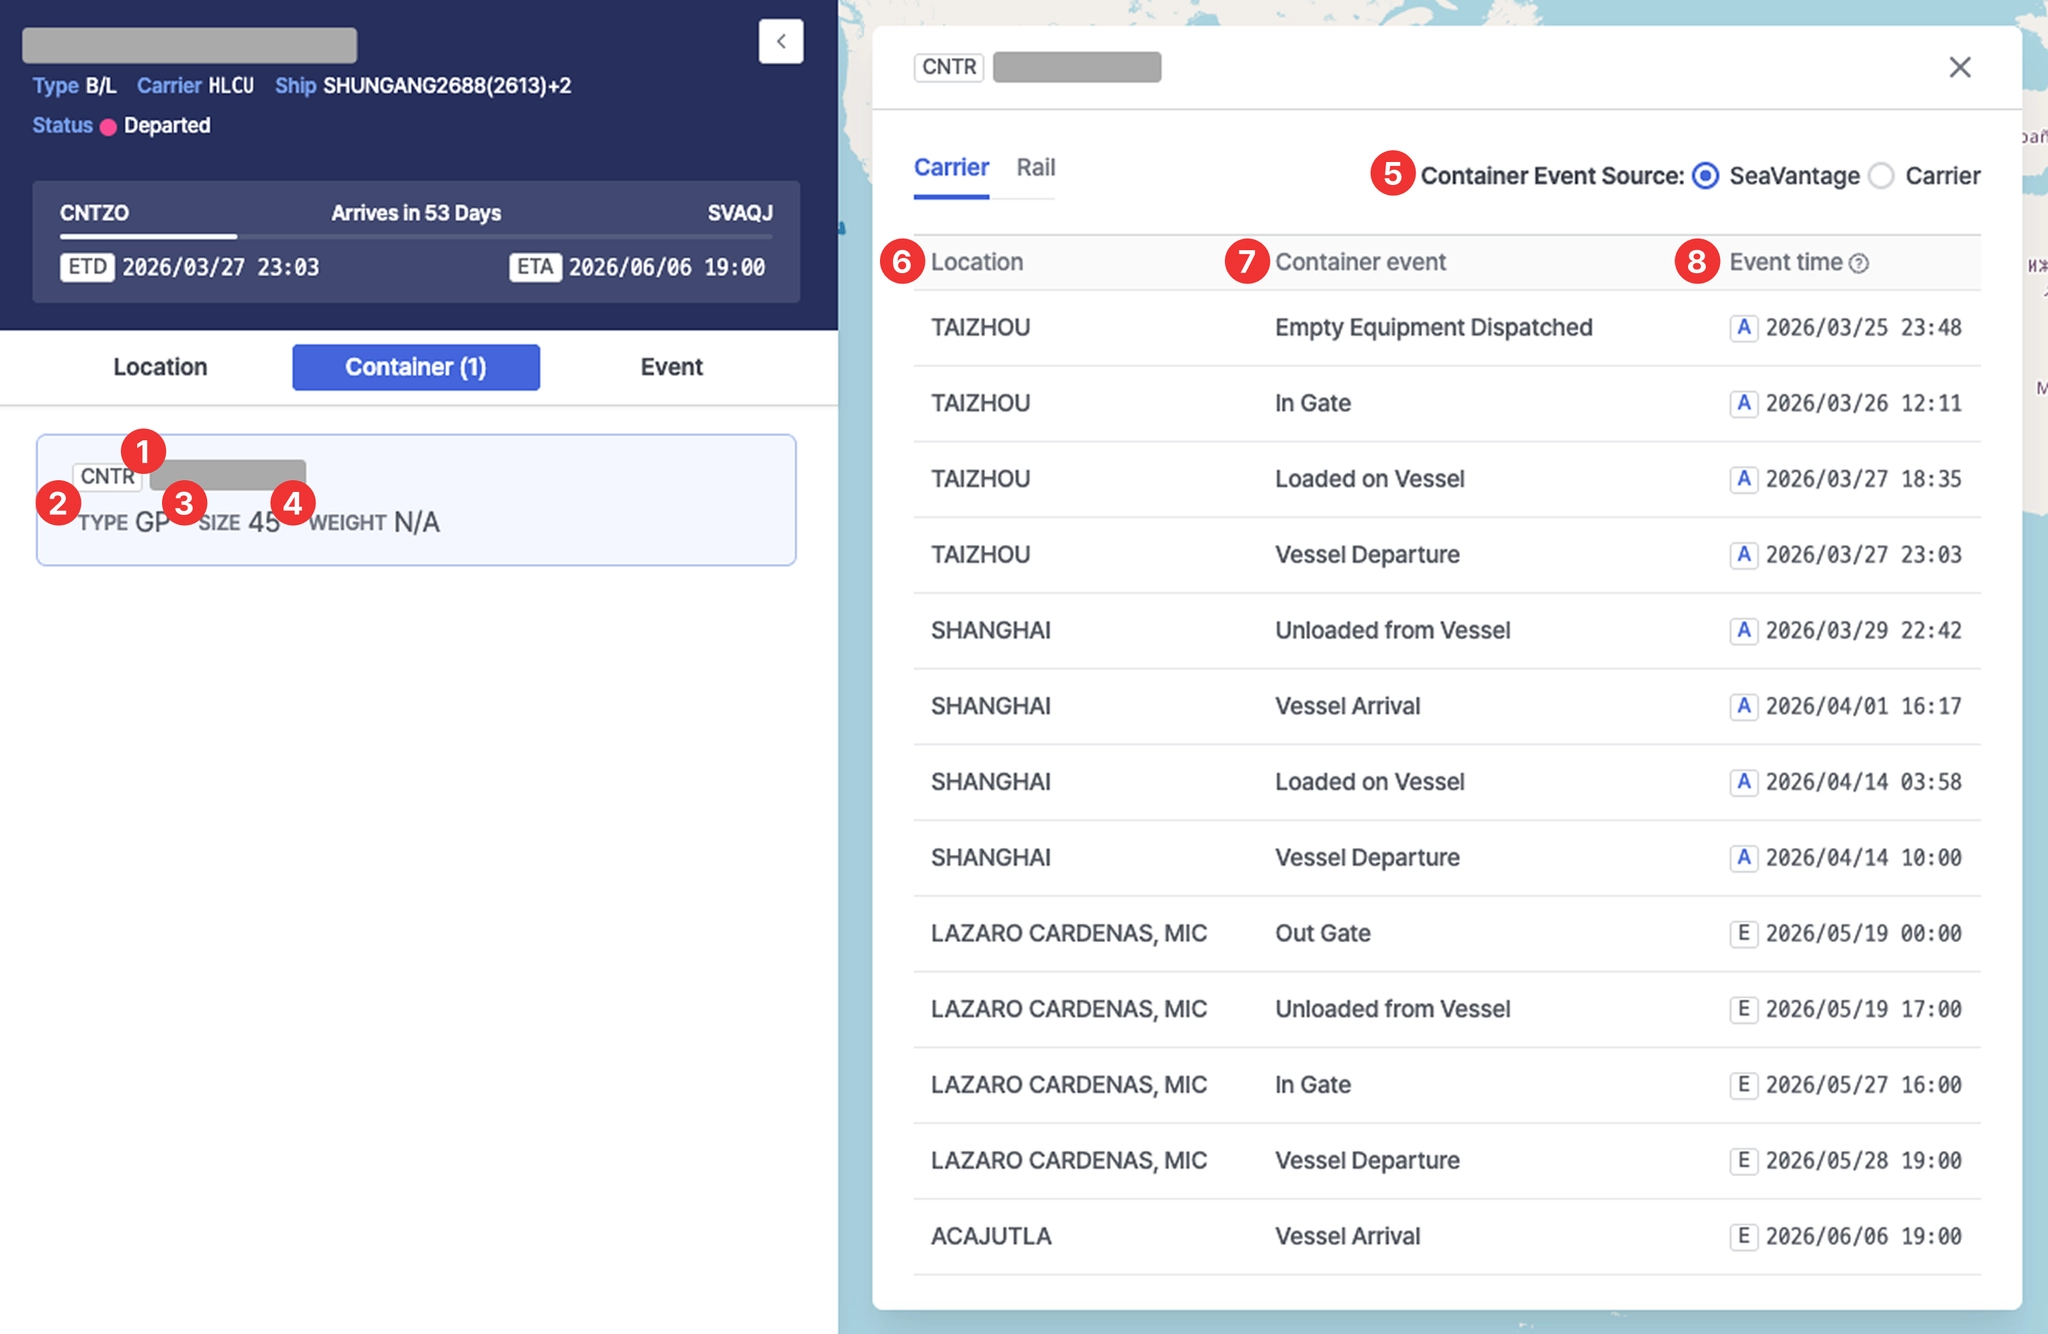
Cargo Insight > Shipment Detail View > Container > Carrier Tab
No. | Description |
1 | Container number |
2 | Container type code |
3 | Container size |
4 | Container weight |
5 | - SeaVantage: Container event information analyzed and standardized by SeaVantage
- Carrier: Container event information provided directly by the carrier |
6 | Location where the event occurred |
7 | Container event |
8 | Event timestamp
- A: Actual event time
- E: Estimated event time |
2. Rail
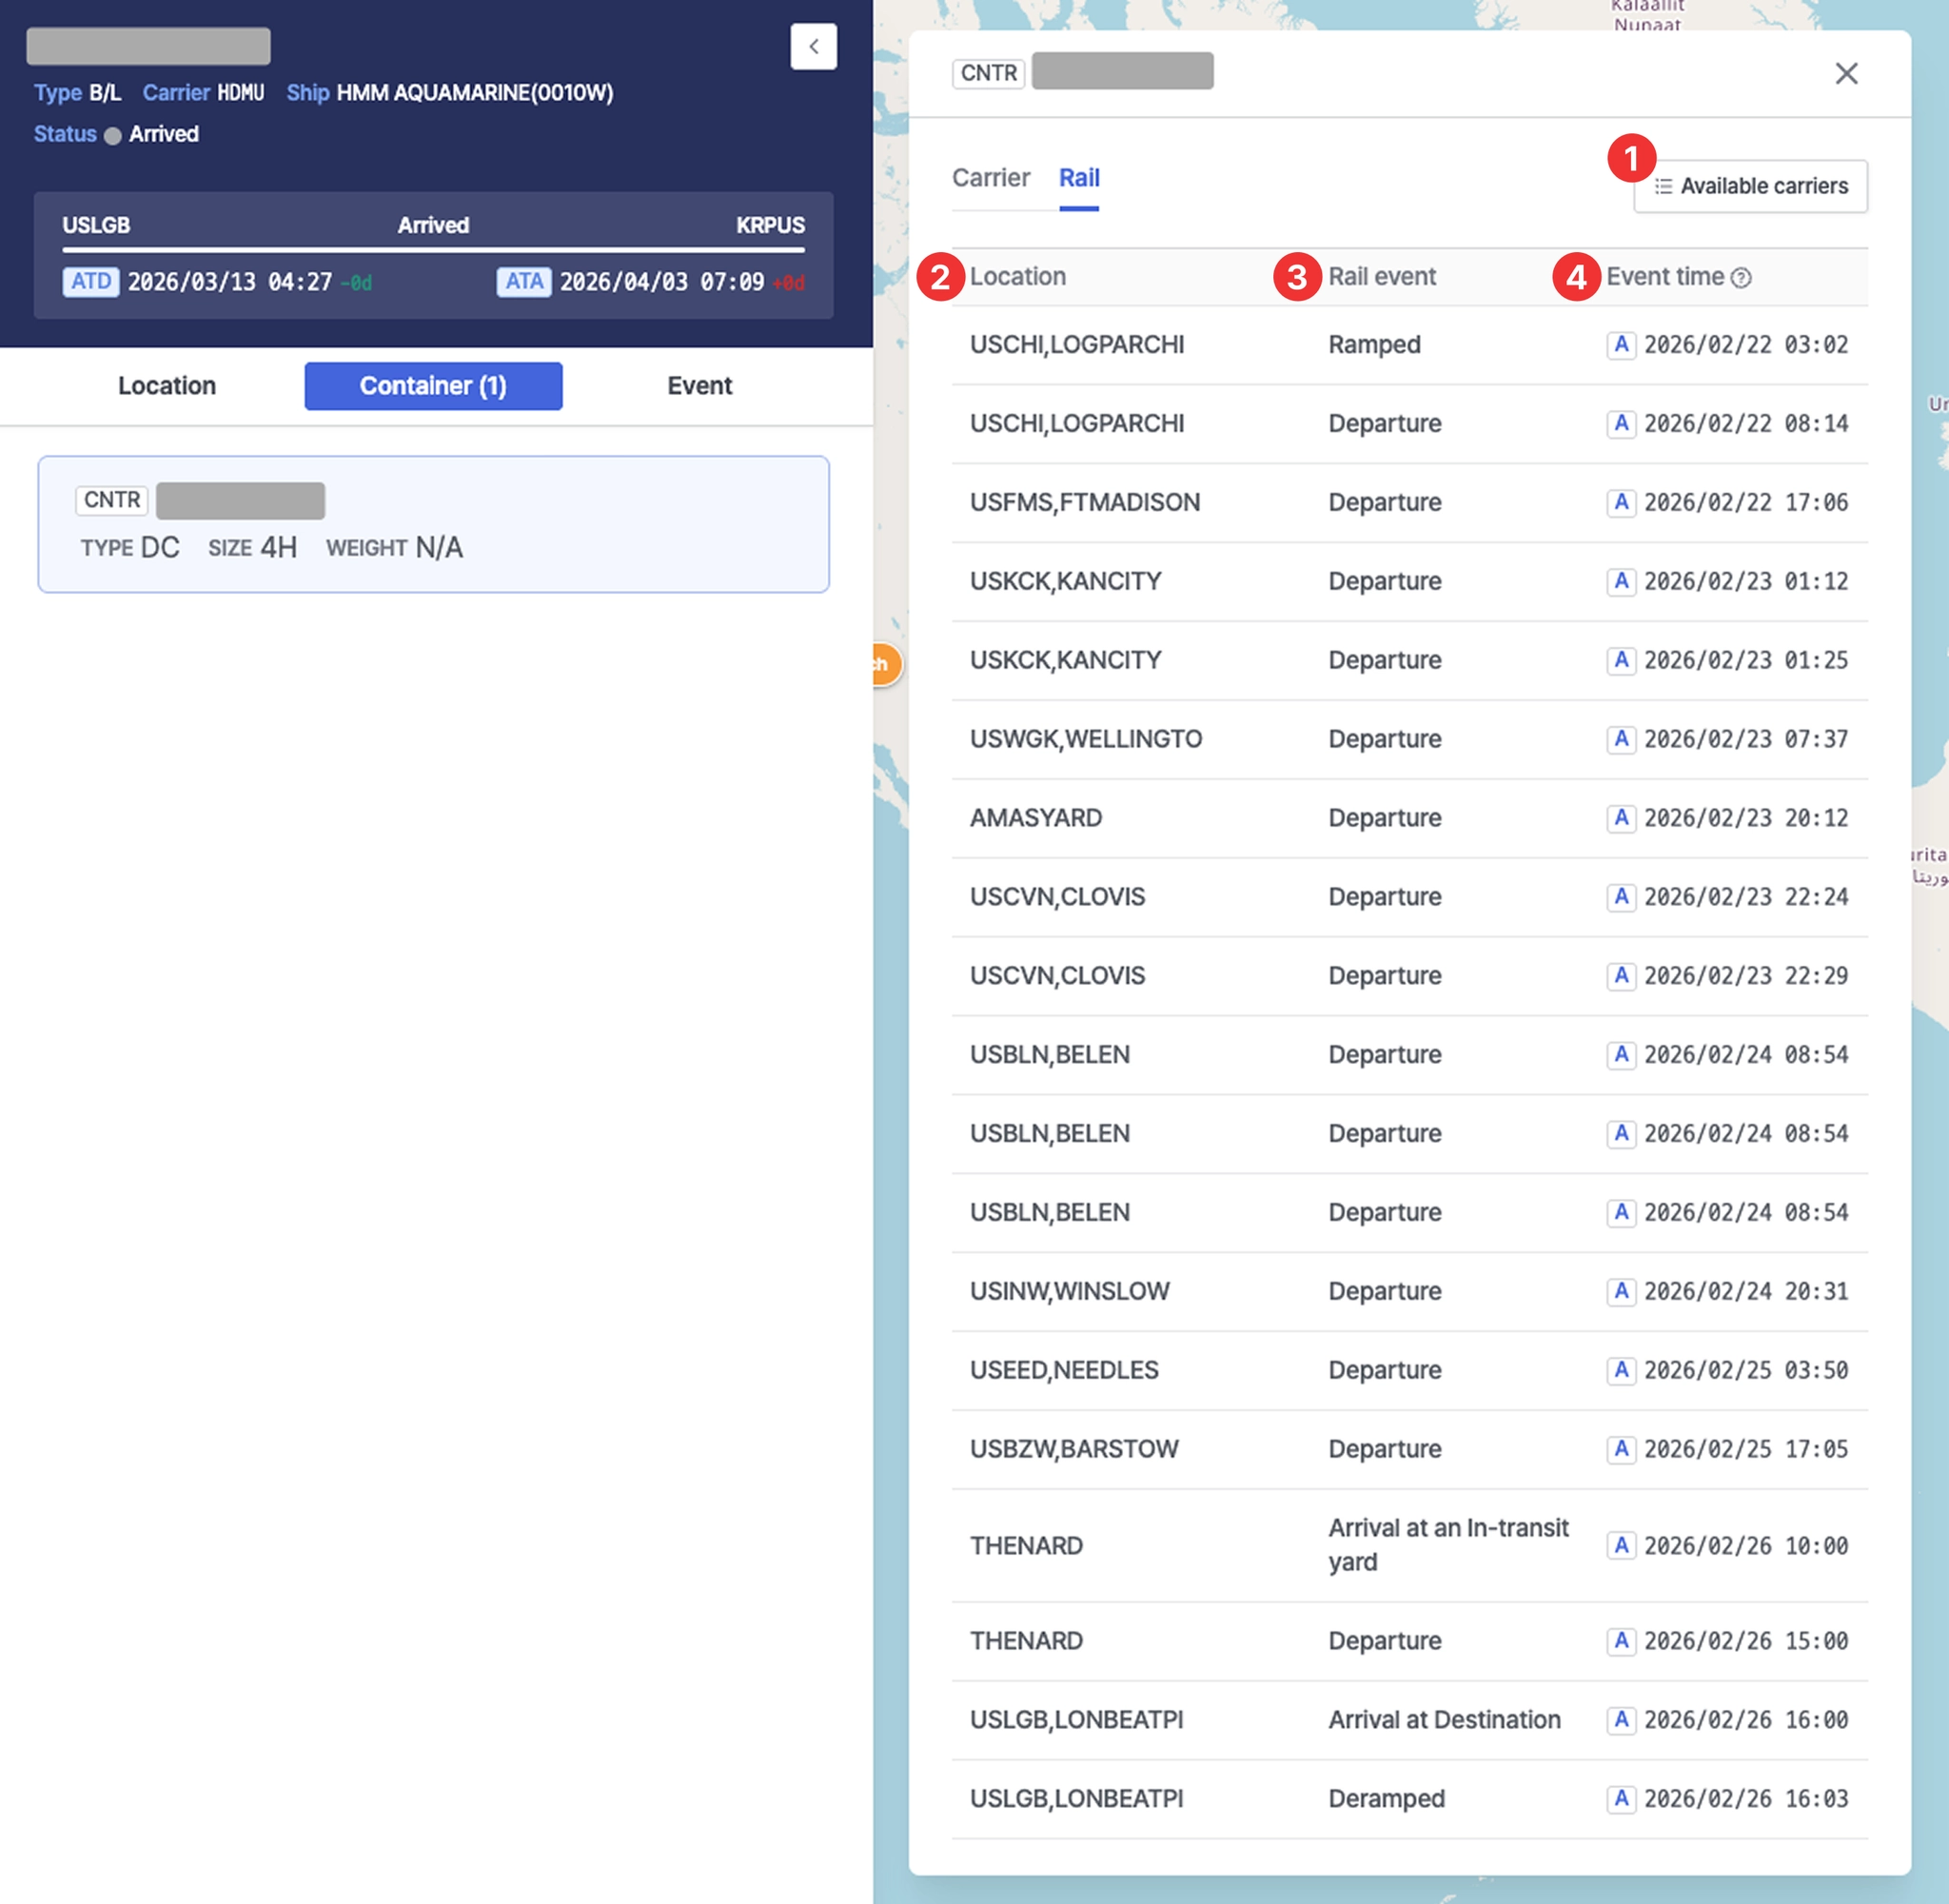
Cargo Insight > Shipment Detail View > Container > Rail Tab
No. | Description |
1 | List of carriers providing rail-related events |
2 | Location where the rail-related event occurred |
3 | Rail-related container event |
4 | Rail-related event timestamp
- A : Actual event time
- E : Estimated event time |
Event
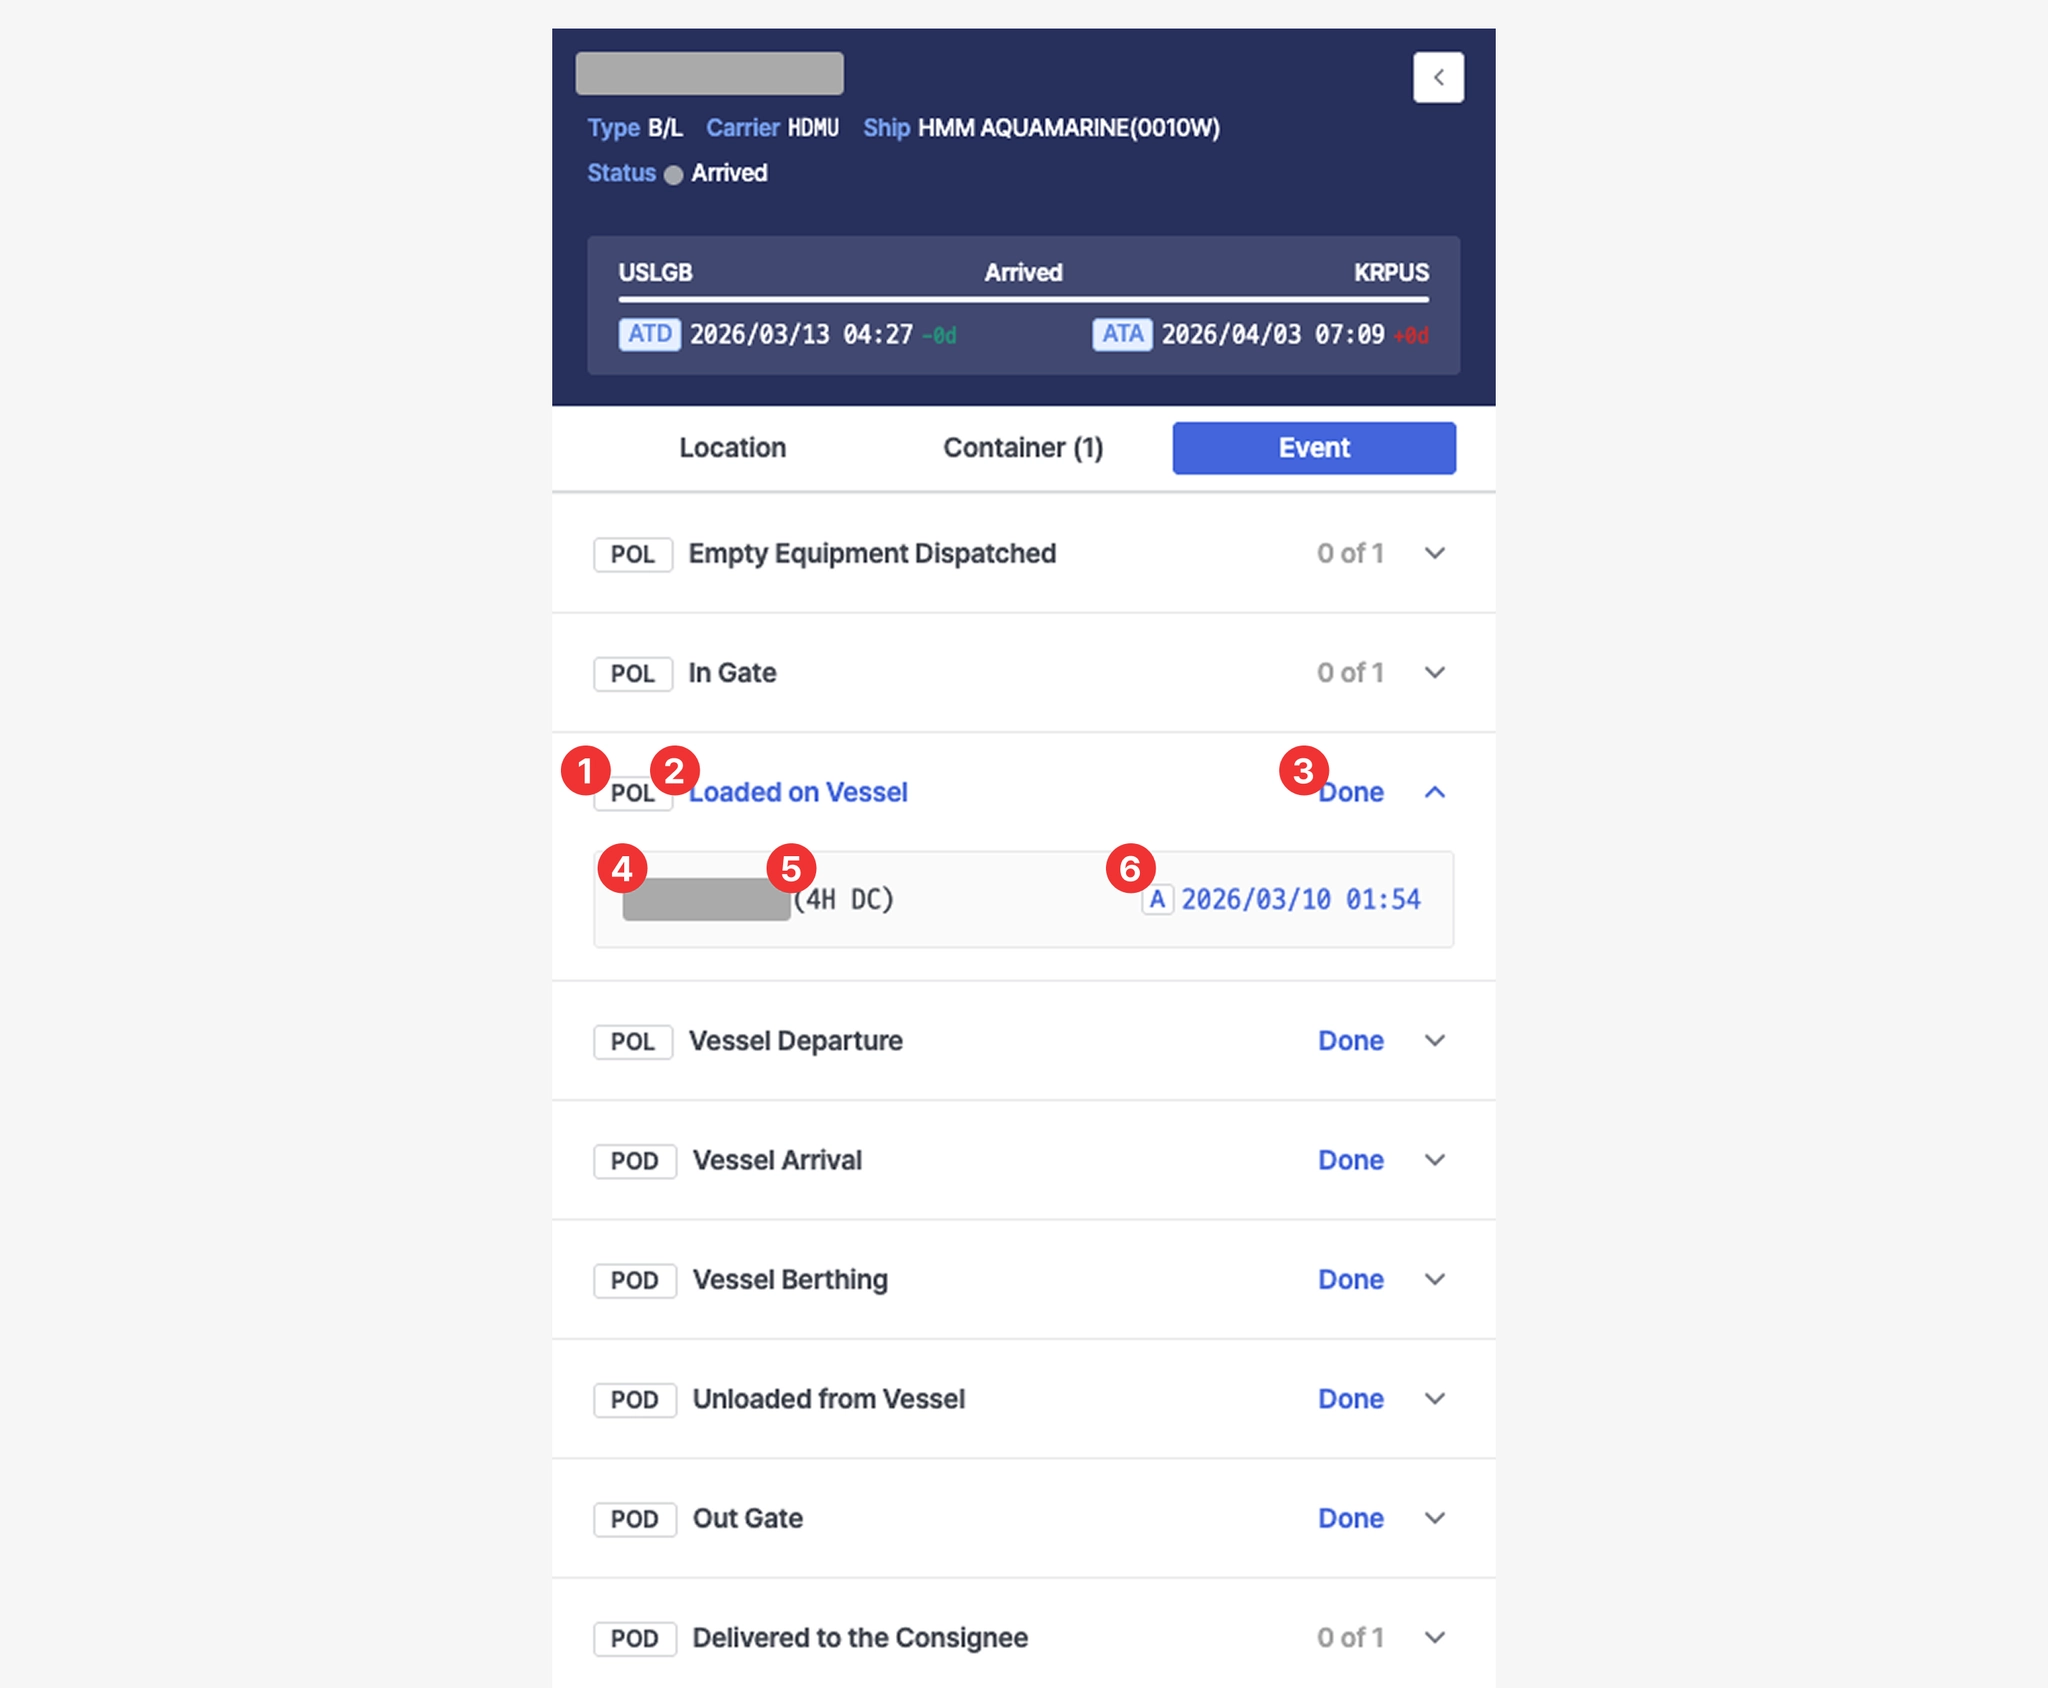
Cargo Insight > Shipment Detail View > Event Tab
No. | Description |
1 | Location Type
- POL: Port of Loading
- TS-N: Transshipment
- POD: Port of Discharging |
2 | Container event |
3 | - Done : All container events for the shipment have been completed
- N of N : Number of containers with completed events out of the total containers in the shipment |
4 | Container number |
5 | Container size and type |
6 | Actual container event timestamp |
Map
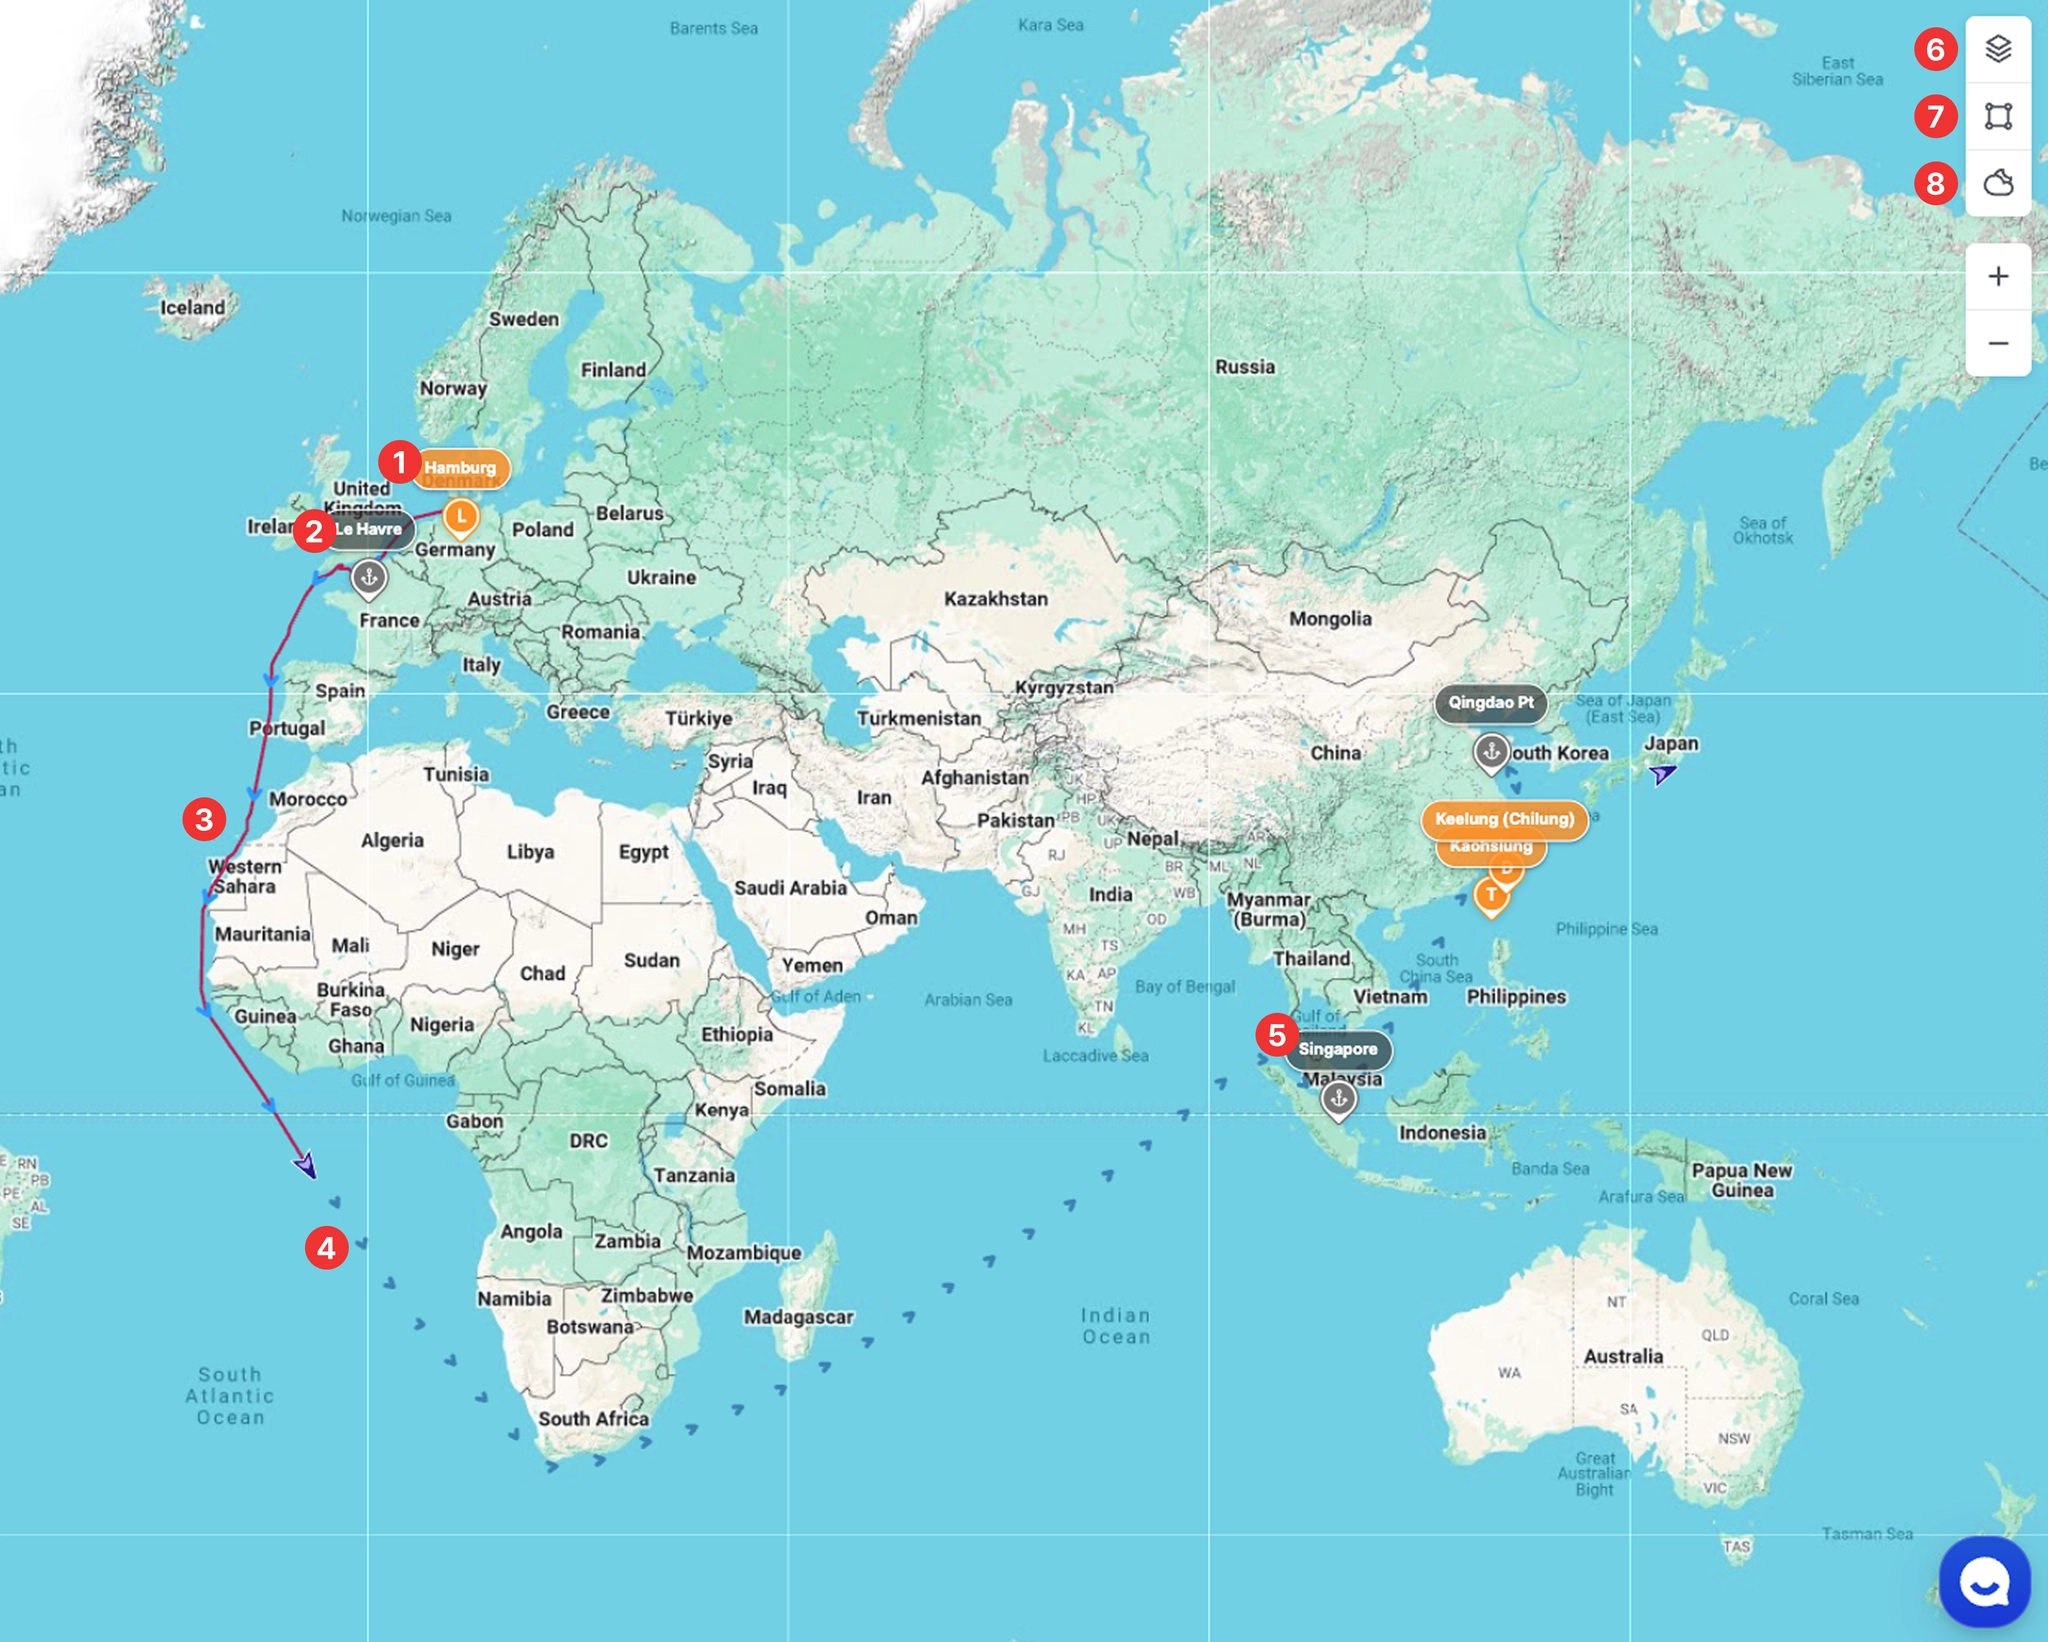
Cargo Insight > Shipment Detail > Map Area
1. Orange Marker
Indicates the Location Type.
2. Gray Marker
Indicates the Calling Port.
3. Red Line
Represents the historical vessel track.
4. Arrow Icon
Indicates the current vessel position.
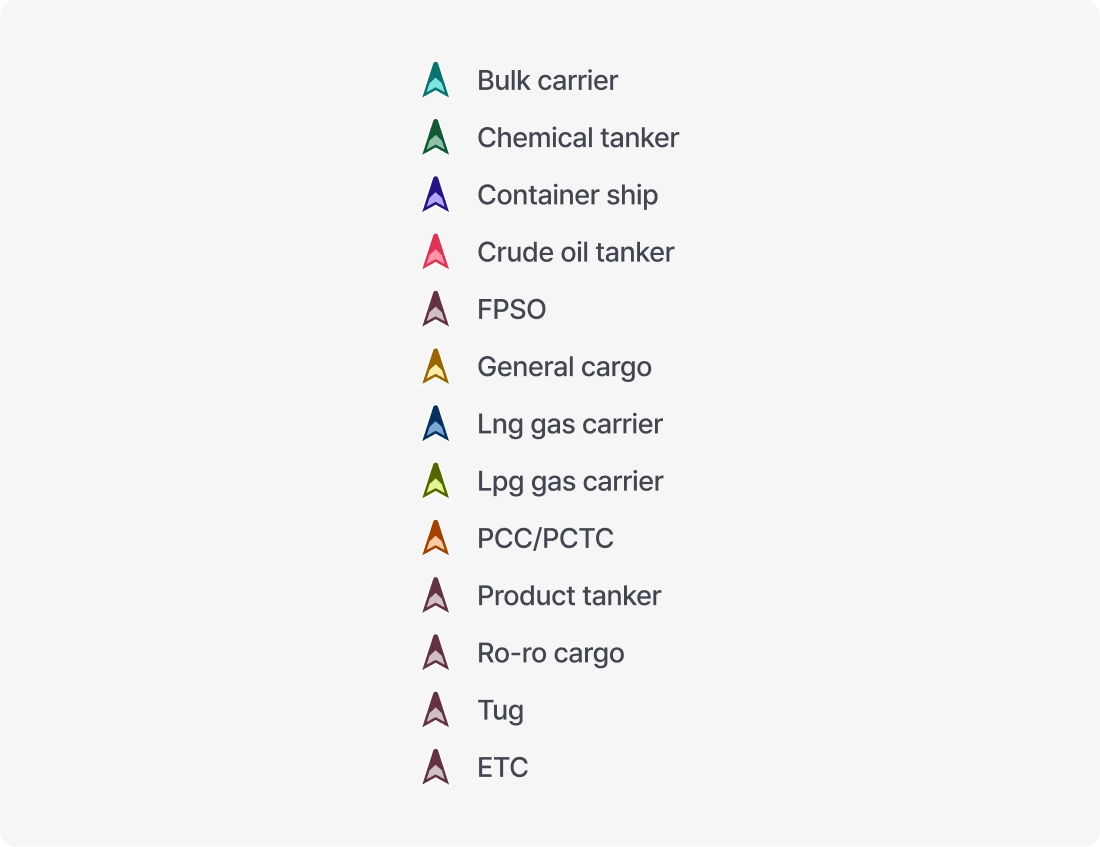
Color Coding by Ship Type
5. Dashed Line
Represents the predicted sailing route of the vessel.
6. Layer
•
Map Styles
◦
Select the preferred map style for the map view.
◦
The list of available map styles can be managed in Settings. You can update which map styles appear in the Layer panel by configuring them on the Settings page.
•
Area
◦
Displays specific geographic and regulatory areas on the map:
▪
ECA (Emission Control Area)
▪
EEZ (Exclusive Economic Zone)
▪
JWC (Joint War Committee)
▪
HRA (High Risk Area)
▪
TSS (Traffic Separation Scheme)
•
Custom zone
◦
Displays user-defined custom areas on the map.
•
Label
◦
Ship name : Displays the vessel name below each vessel icon on the map.
7. Tools
•
Expand
◦
Switches the map to full-screen mode, allowing key information to be viewed more clearly.
◦
Press the Esc key to exit full-screen mode.
•
Capture
◦
Saves the current screen as an image, enabling users to share or archive it for reference.
•
Distance
◦
A measurement tool that allows users to calculate the distance between selected points on the map.
◦
Click the starting point and then the destination point in sequence to view the Bearing, Great Circle Distance, and Rhumb Line Distance.
◦
Measurement instructions:
▪
Click to add points along the route while measuring.
▪
Double-click to stop drawing the line.
▪
Click the map again to start a new distance measurement.
▪
To completely exit distance measurement mode, press the Esc key or click the Distance button again.
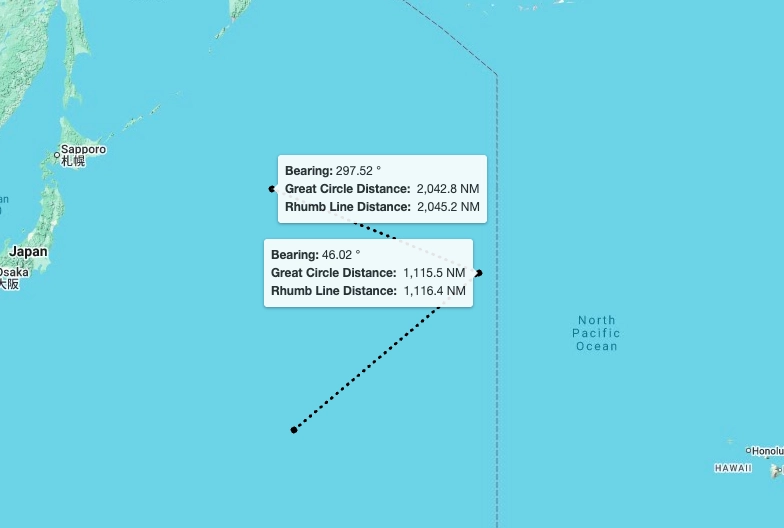
Cargo Insight > Map Area > Distance Measurement View
•
Refresh
◦
Reloads the latest data and immediately updates the information displayed on the screen.
8. Weather
•
Cyclone
◦
Displays official cyclone alerts and forecast information issued by the Joint Typhoon Warning Center (JTWC) on the map.
◦
Cyclone intensity is indicated by color, allowing users to assess severity.
◦
Shows a list of currently active cyclones.
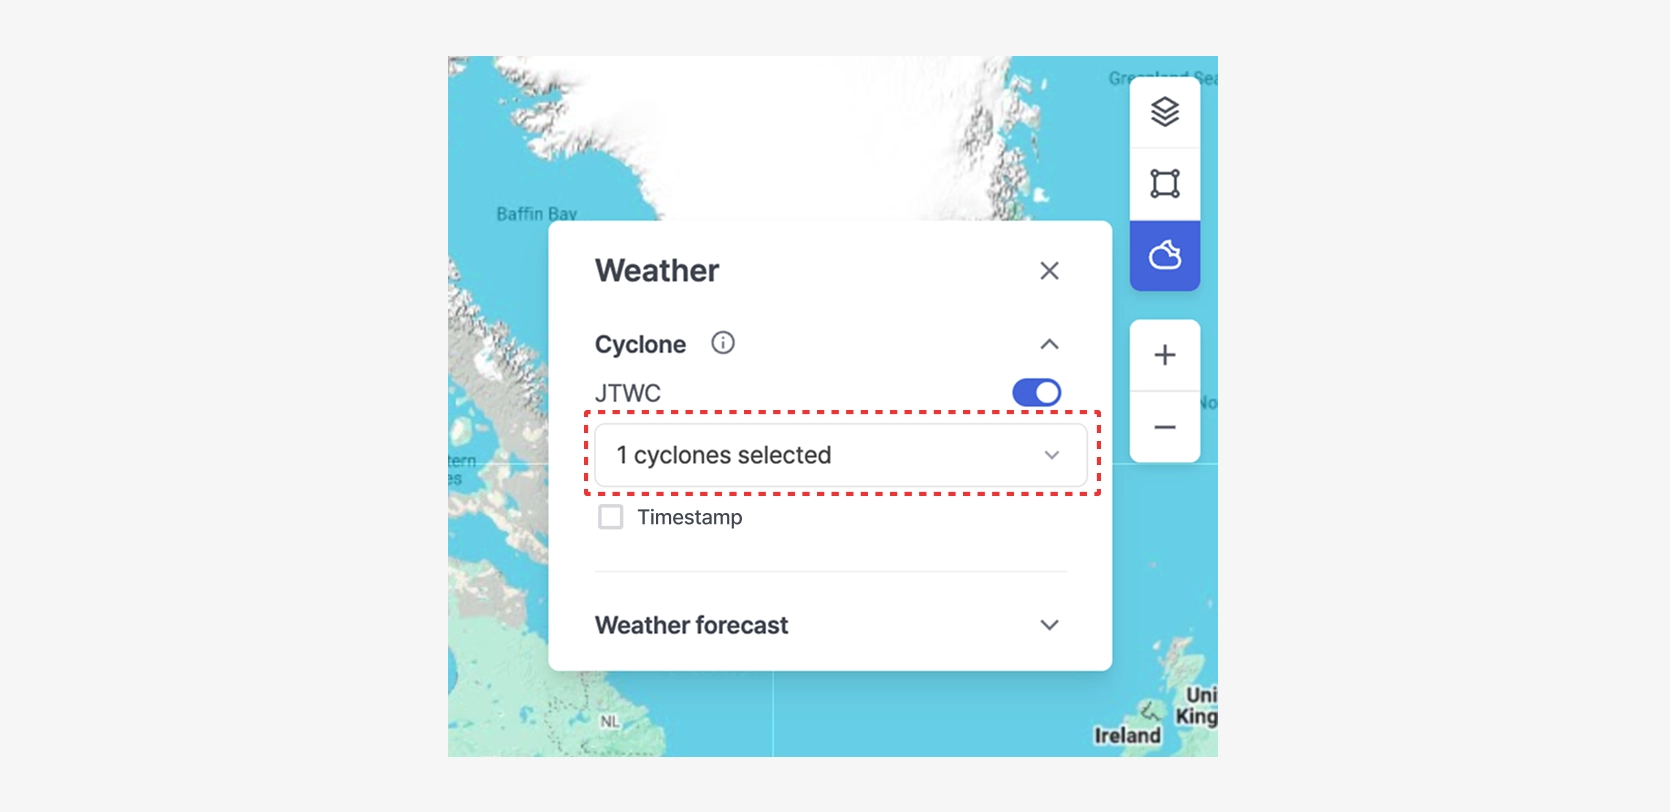
Cargo Insight > Map Area > Weather > Cyclone — View with One Cyclone Selected
◦
Displays the timestamp indicating when the cyclone information was received.
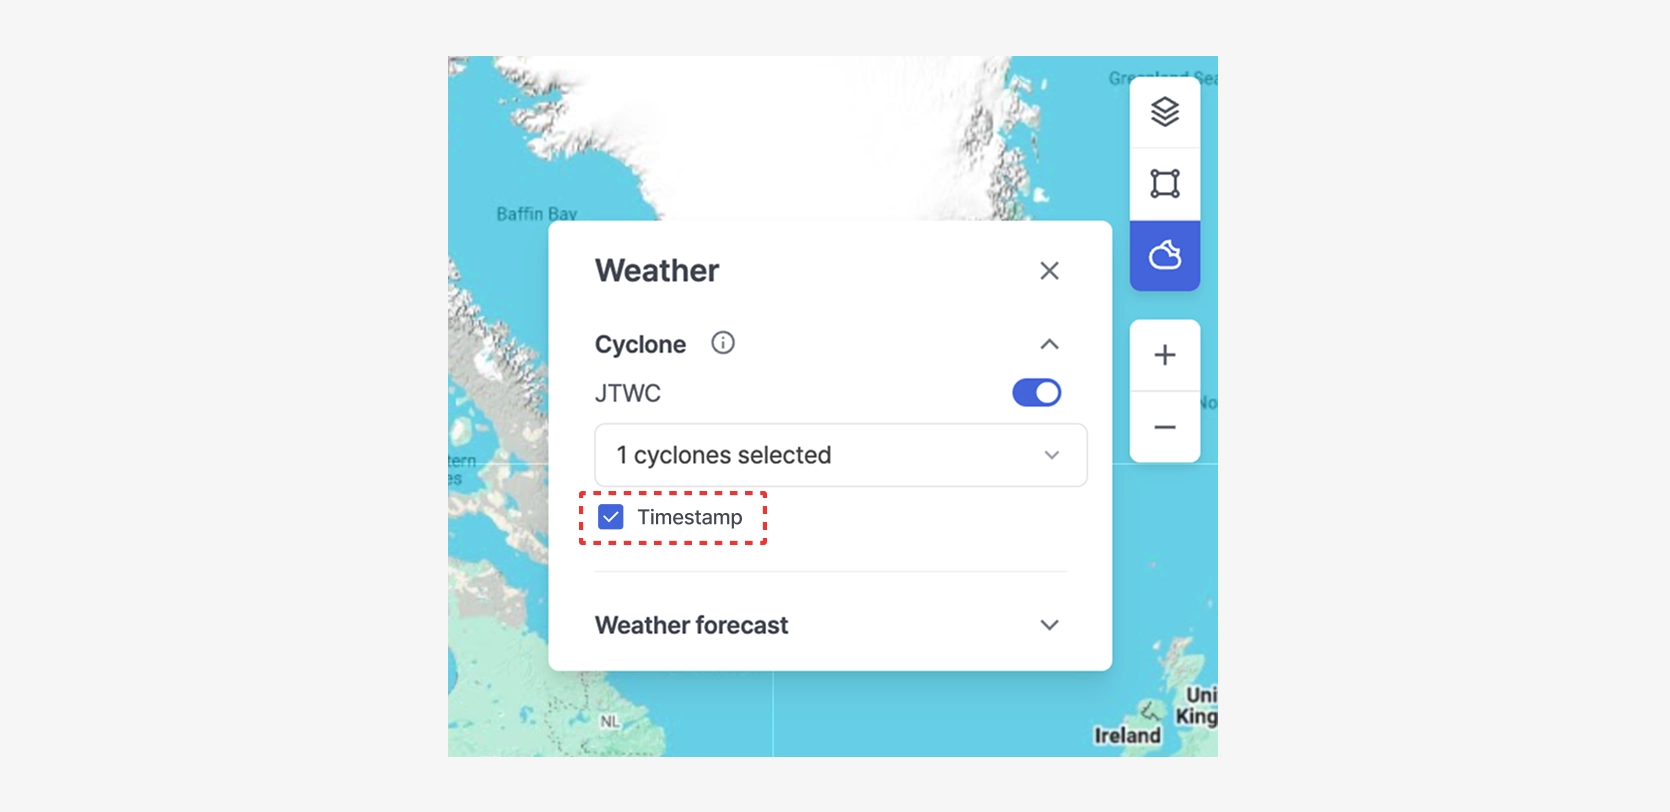
Cargo Insight > Map Area > Weather > Cyclone — View with Timestamp Displayed
•
Weather Forecast
◦
Current: Displays ocean current direction and speed.
◦
Wind: Displays surface wind direction and wind speed.
◦
Wave: Displays wave height and wave direction.
◦
Swell: Displays swell height and direction (long-period waves generated offshore).
◦
Select a date on the timeline to view forecast information for that specific date.
◦
Click the play button on the timeline to view animated changes in the forecast over time.
Note: While playback is active, changing the zoom level or performing other interactions is not available.
◦
Weather forecast data is displayed at a 1° resolution by default, switches to 0.5° resolution at zoom levels 6–7, and to 0.25° resolution at zoom levels 8 and above.
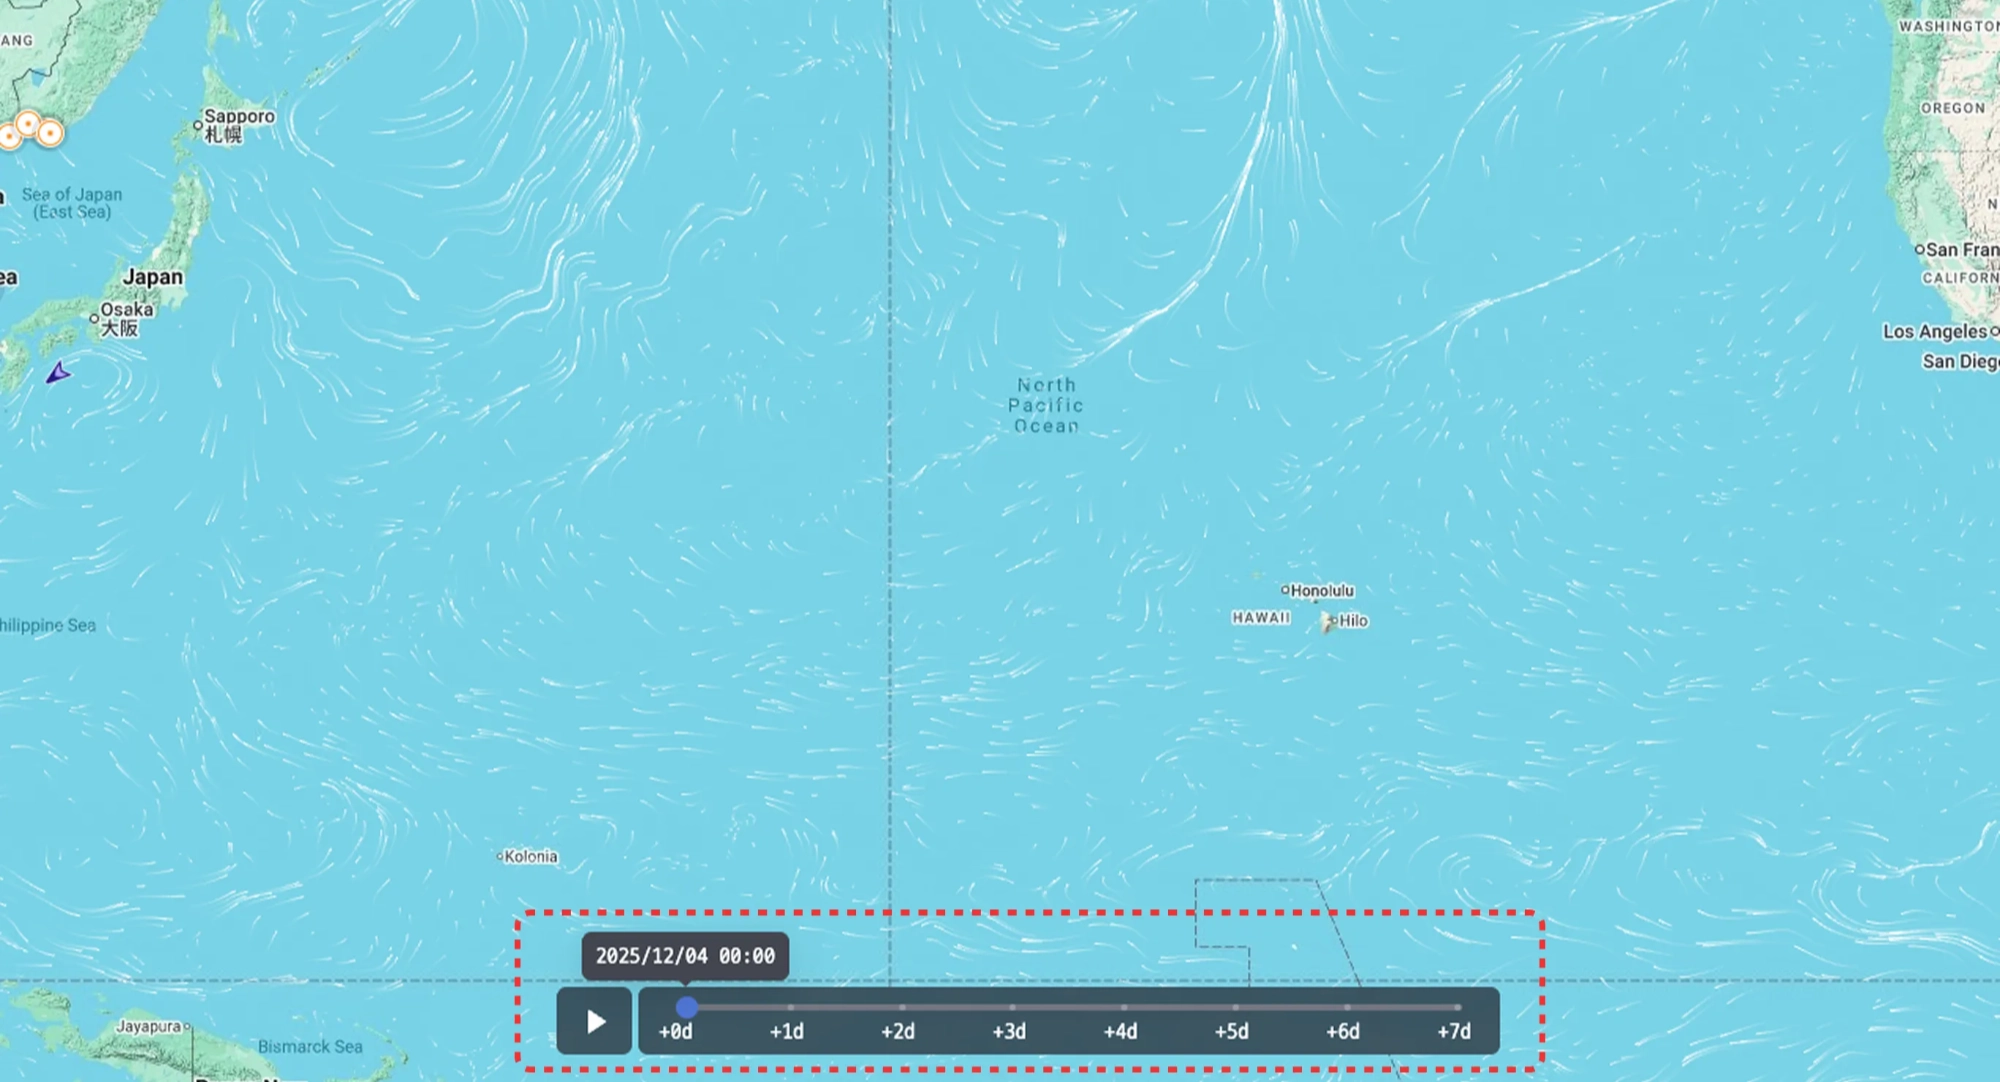
Cargo Insight > Map Area > Weather Forecast — View Enabled