

Statistics Dashboard
The dashboard shows information about the vessels associated with a port, and shows data as of the time of viewing (real-time) when you click the refresh button at the top.
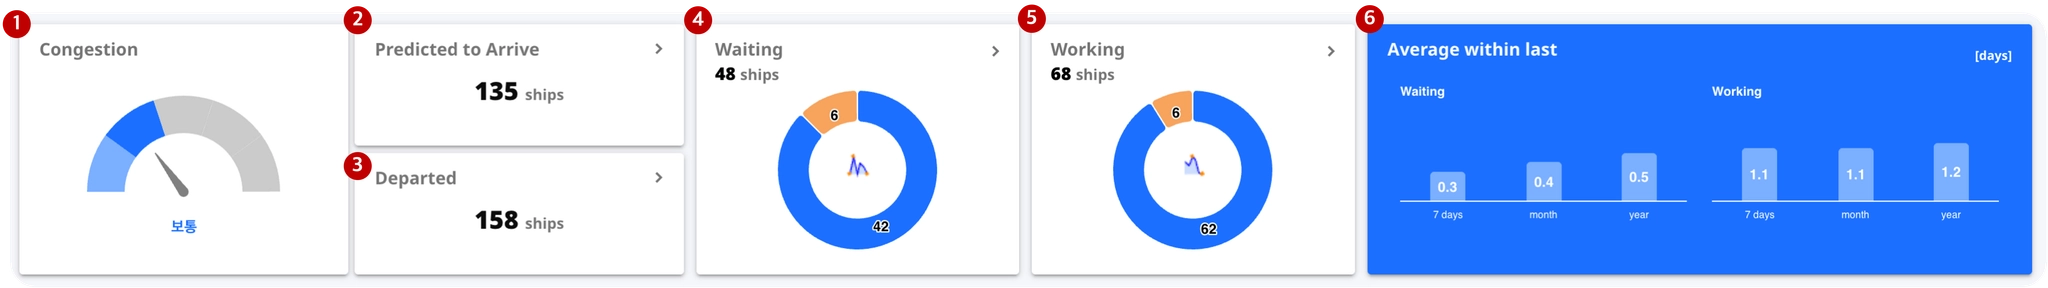
① Congestion
The relative congestion index for your port, relative to all ports served by Port Insight.
Item | Phase separation | Time-based |
Congestion Index | Seamless = light / average = normal / caution = moderate / congested = heavy / severe = severe | Real-time |
② Predicted to Arrive
The number of ships headed to the port
Item | Data Criteria | Time-based |
Number of ships | The number of vessels currently heading toward a port in real time based on SeaVantage Predictive Analytics data, excluding vessels that have already arrived at the port. | Real-time |
Vessel List | If you click on the dashboard number, a list of current vessels will appear and you can view vessel arrival forecast information (ETA, PTA). | Real-time |
③ Departed
Number of Ships Berthed Out
Item | Data criteria | Time-based |
Number of ships | The number of ships that have departed, with the actual time of departure (ATD) recorded. | Last 3 days |
Vessel List | If you click on the number Departed, a list of vessels will appear and you can see the vessel arrival and berthing information (ATA, ATB, ATD). | Last 3 days |
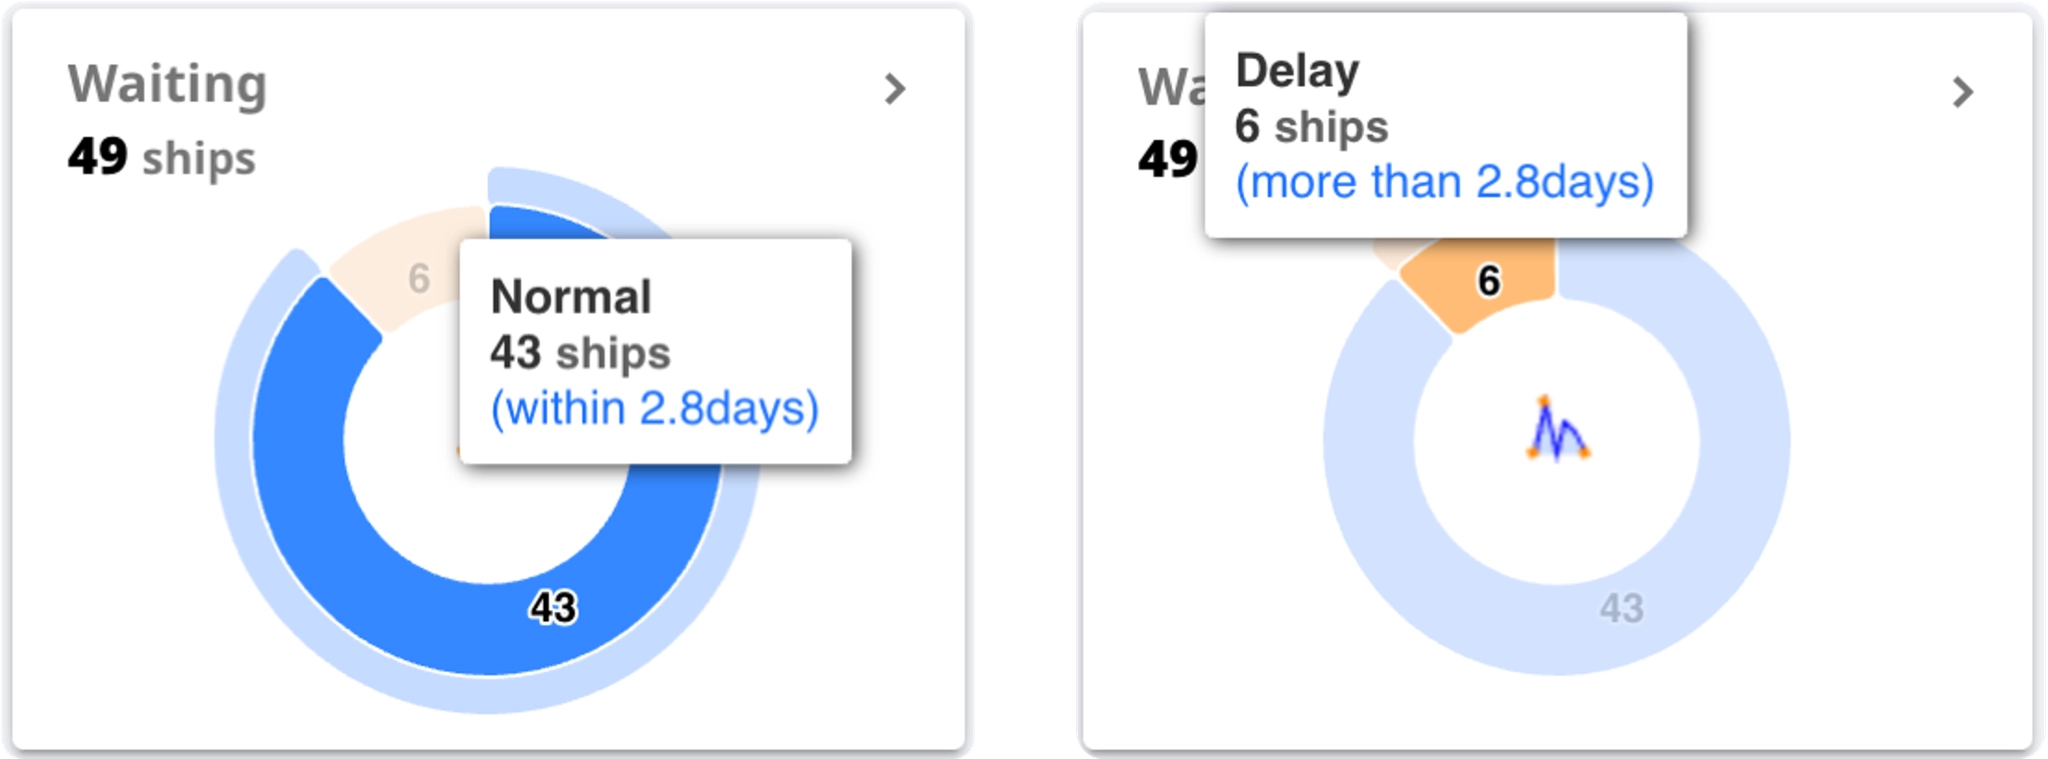
④ Waiting
Number of vessels waiting to enter the port.
Item | Data criteria | Time-based |
Number of ships | When a vessel enters a port area and stops, it is included in the waiting vessel count, which is recorded as the actual time of arrival (ATA). | Real-time |
Stand-by time | The time until the waiting ship docks is calculated as Waiting days. | Average value over the last 7 days |
Vessel List | Clicking on a dashboard number will bring up a list of vessels and their arrival times (ATA). | Real-time |
Port Insight ATA (Actual Time of Arrival)
In Port Insight, ATA refers to when a vessel has stopped since entering the port area, which may differ from the schedule time provided by the shipping line.
What do the blue and orange colors in the chart mean?
The blue color indicates the number of ships with a wait time lower than the average per port, and conversely, the orange color indicates the number of ships with a wait time higher than the average per port. You can see the average time by hovering your mouse over the chart.
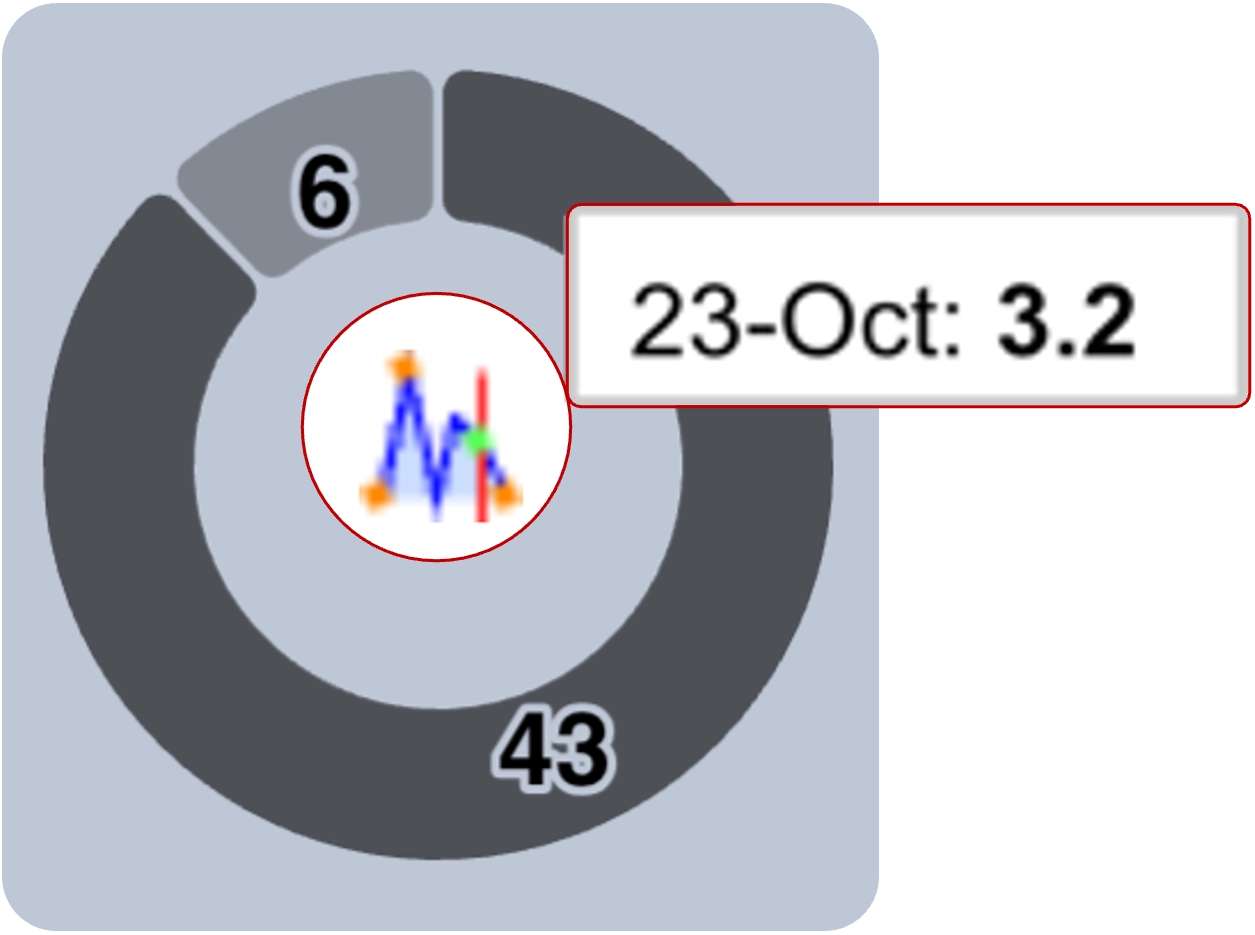
What do the line graphs in the chart mean?
This is a daily chart that shows the trend in stand-by time over the past week. We've included the vessel count information to give you more insight. Similarly, you can hover over a day to see the wait time information for that day.
⑤ Working
Number of vessels berthing / average berthing (working) time
Item | Data criteria | Time-based |
Number of Ships | The number of vessels berthing, with the start of berthing recorded as the Actual Time of Berth (ATB). | Real-time |
Docking (working) time | The time until the ship leaves the berth is counted as working days. | Average value over the last 7 days |
Vessel List | Clicking on a dashboard number will bring up a list of the corresponding vessels and allow you to view vessel arrival and berthing information (ATA, ATB). | Real-time |

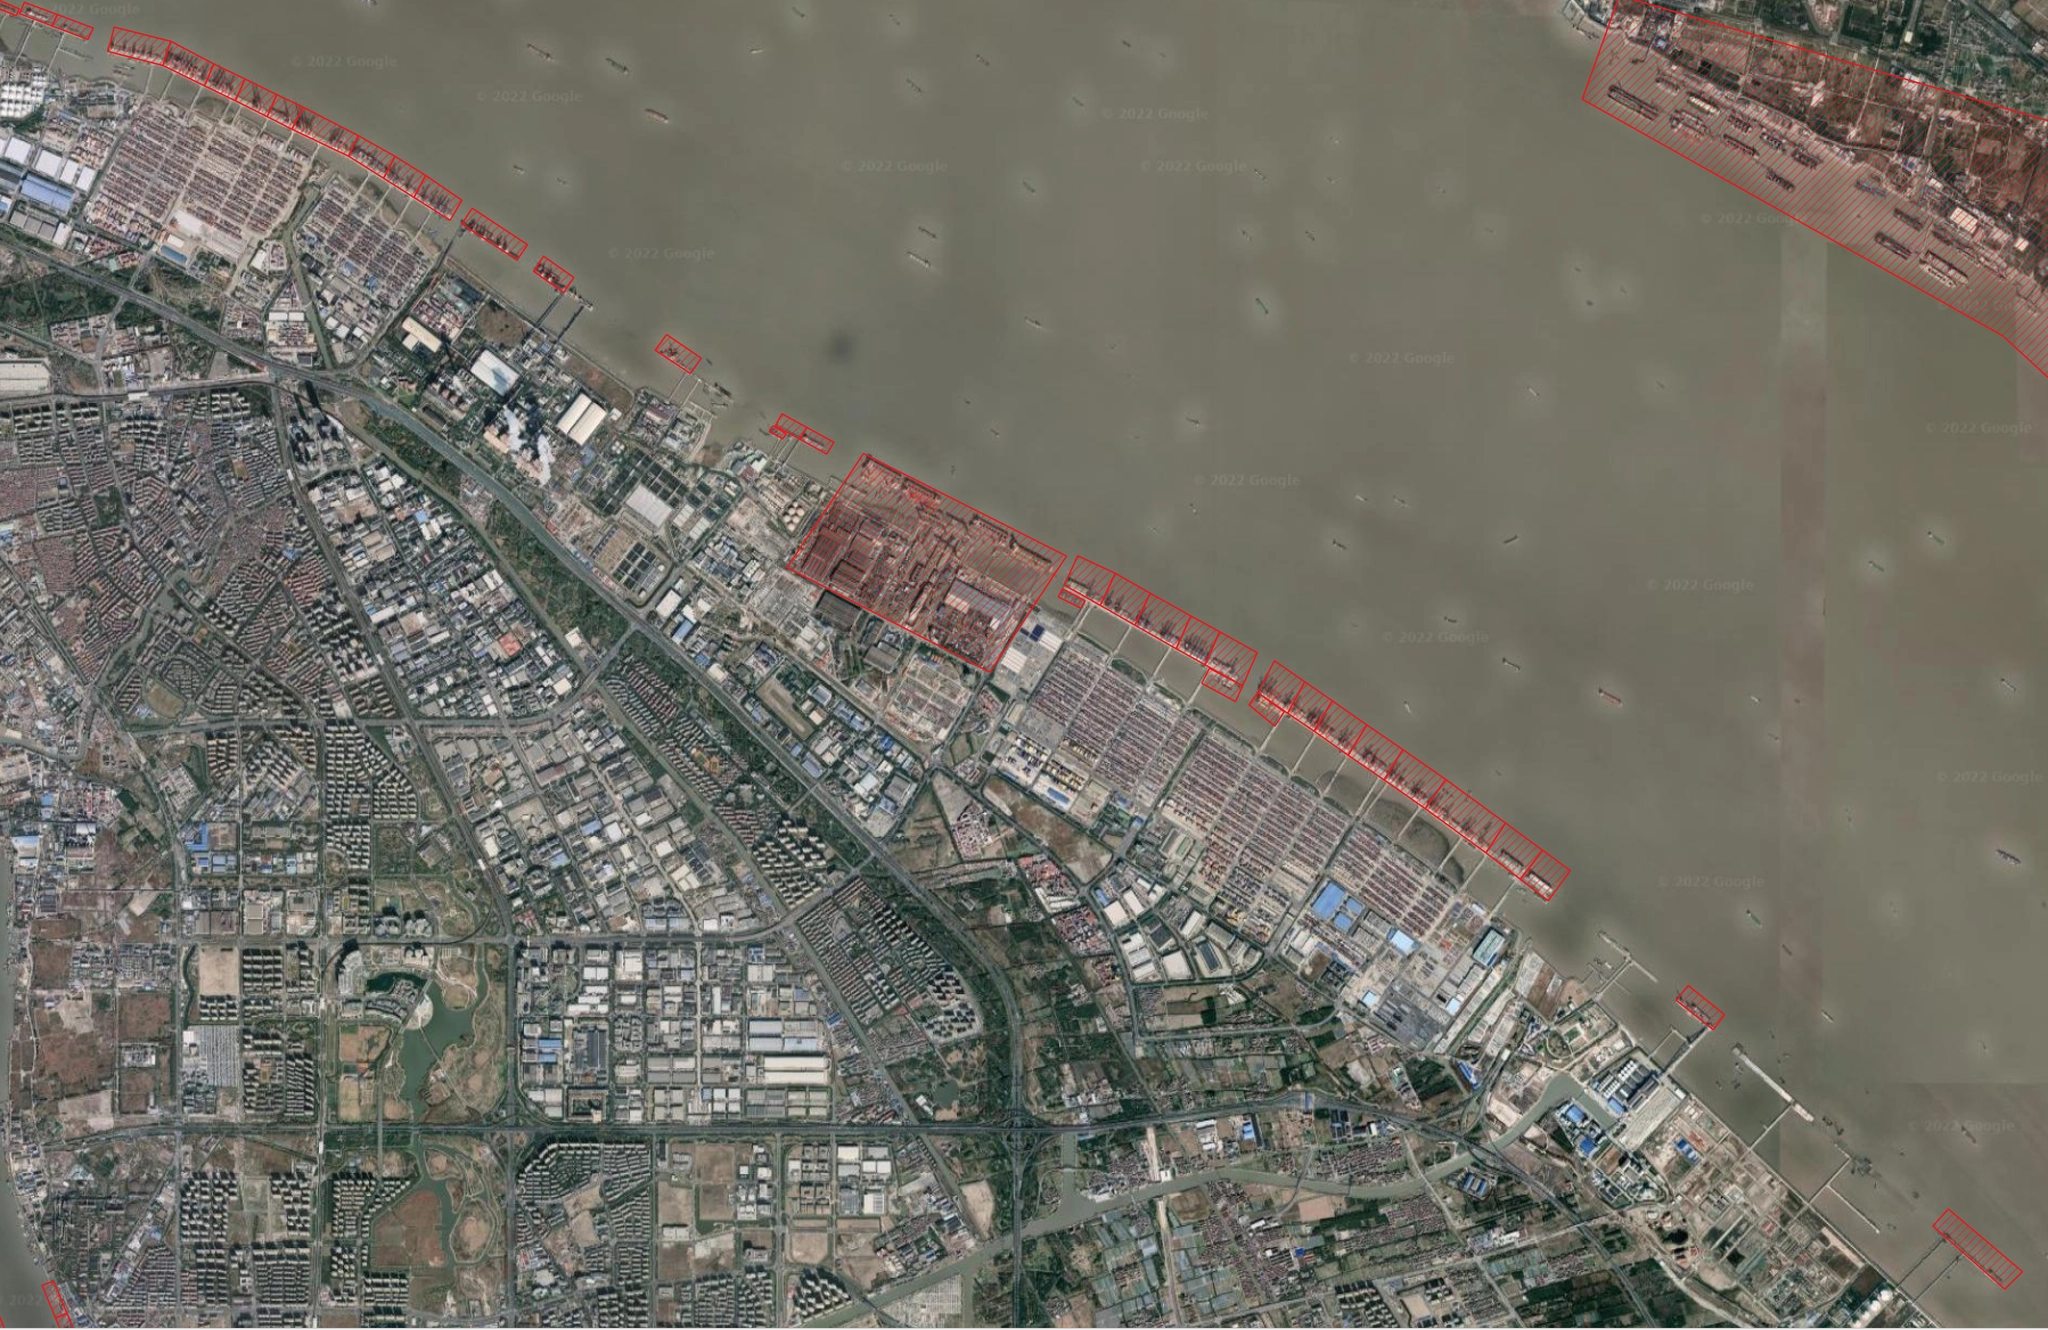
The berth area was defined by SeaVantage based on things like AIS and satellite imagery.
⑥ Average within Last
Standby time (date) and duration (date) statistics based on today's date
Item | Phase separation | Time-based |
Waiting | 7 Days, 1 Month, 1 Year | Real-time |
Working | 7 Days, 1 Month, 1 Year | Real-time |
Port/Terminal Time Series Statistics Chart
The data in the Overview chart is based on noon local time, and you can view statistical charts by time period. (7days, 30days, 90days, Monthly)
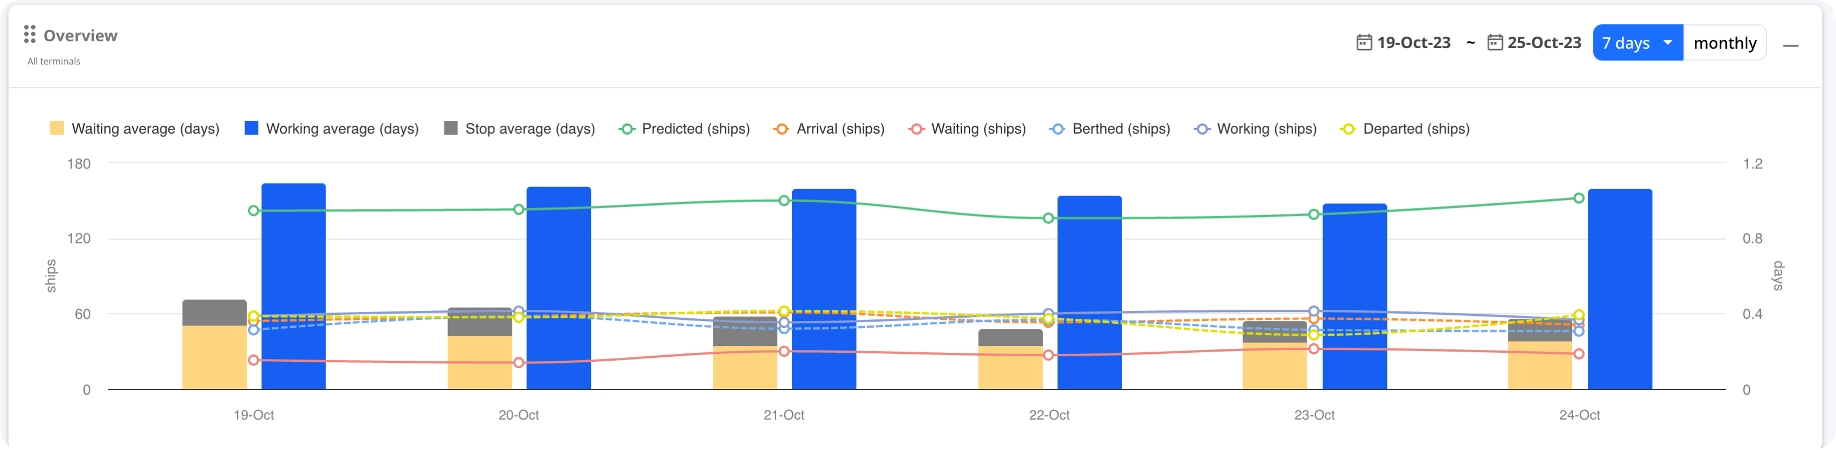
Chart Items
Statistical Data | Description |
Ship Standard | Predicted / Arrival / Waiting / Berthed / Working / Departed |
Days Standard | Waiting average / Working average / Stop Average |
What are Arrival and Berthed, which are only in the statistics chart?
"Arrival" and "Berthed" data are based on a 24-hour time frame, spanning from noon of the previous day to noon of the current day. This allows you to monitor recent atmospheric conditions at the port and identify trends in berthing operations.
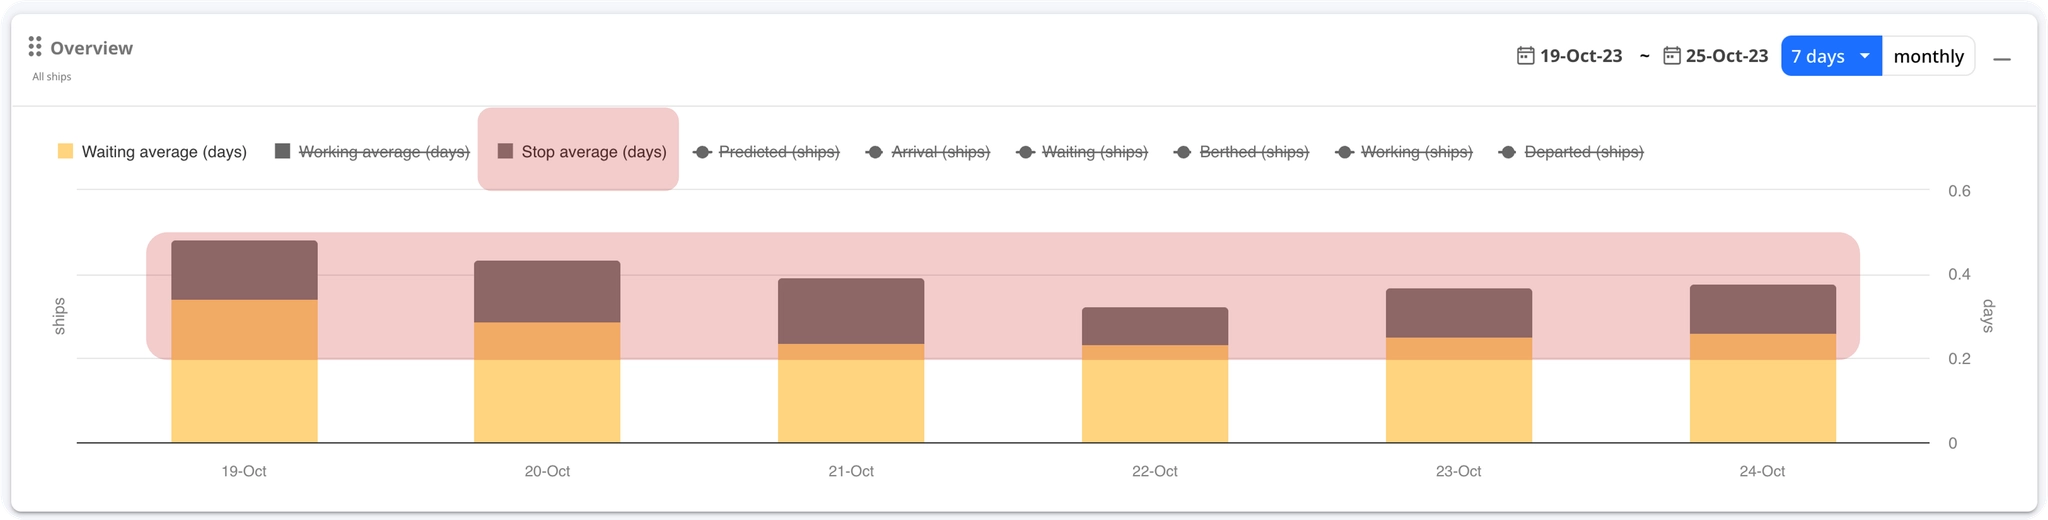
What is the difference between Waiting average and Stop average?
“Stop Average” also refers to the waiting time for vessels traveling toward the port (set as Destination). Whereas “Waiting Average” previously referred to the waiting time of ships in the general Waiting Area of the port, “Stop Average” relates to the stopping time of ships outside of the Waiting Area. This allows us to provide you with more accurate information about waiting times in a more tangible way.
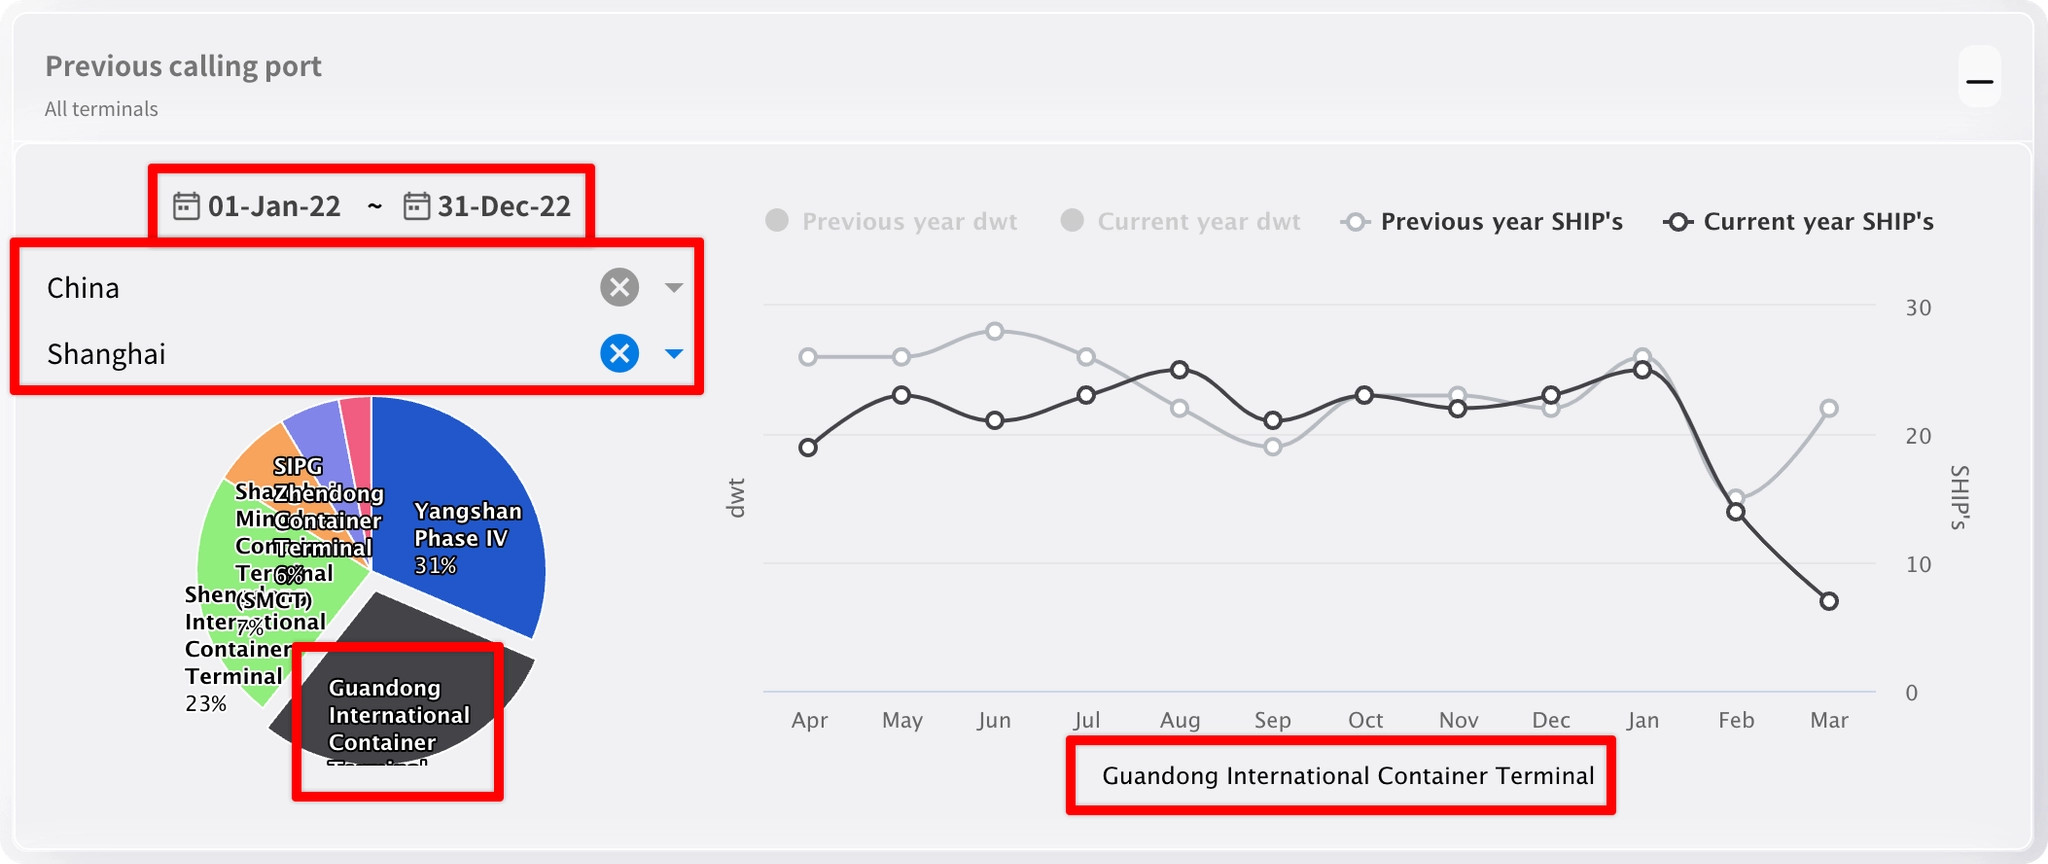
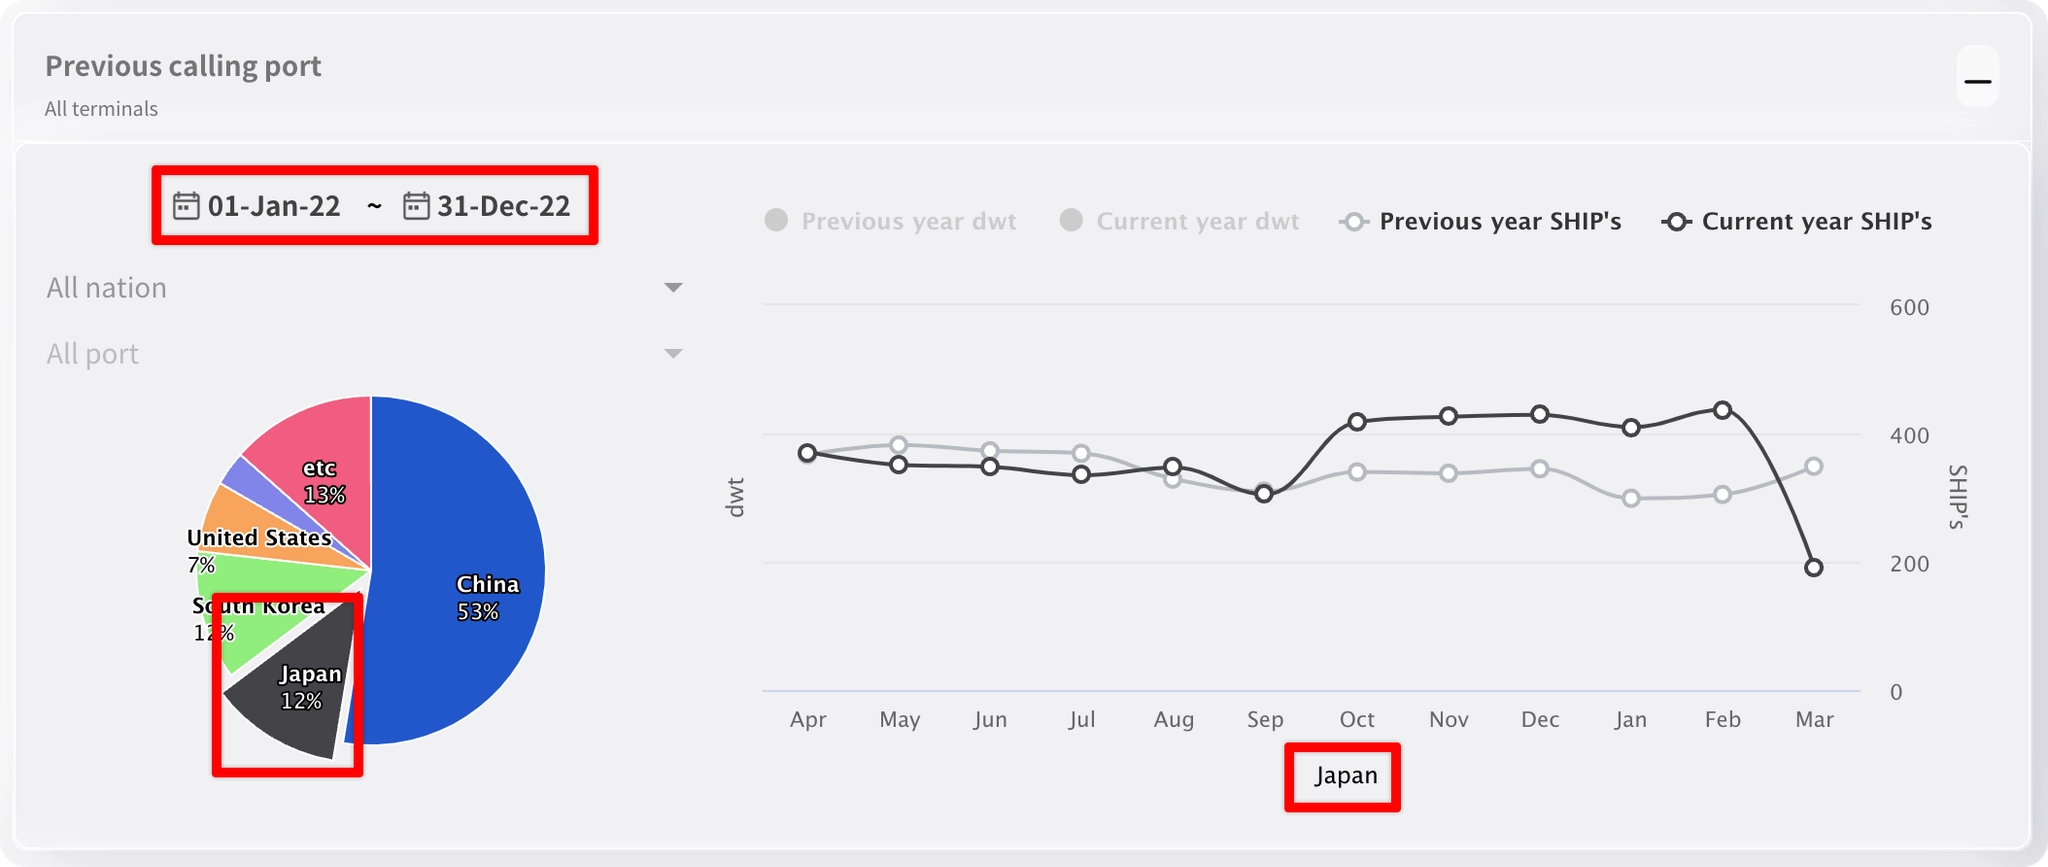
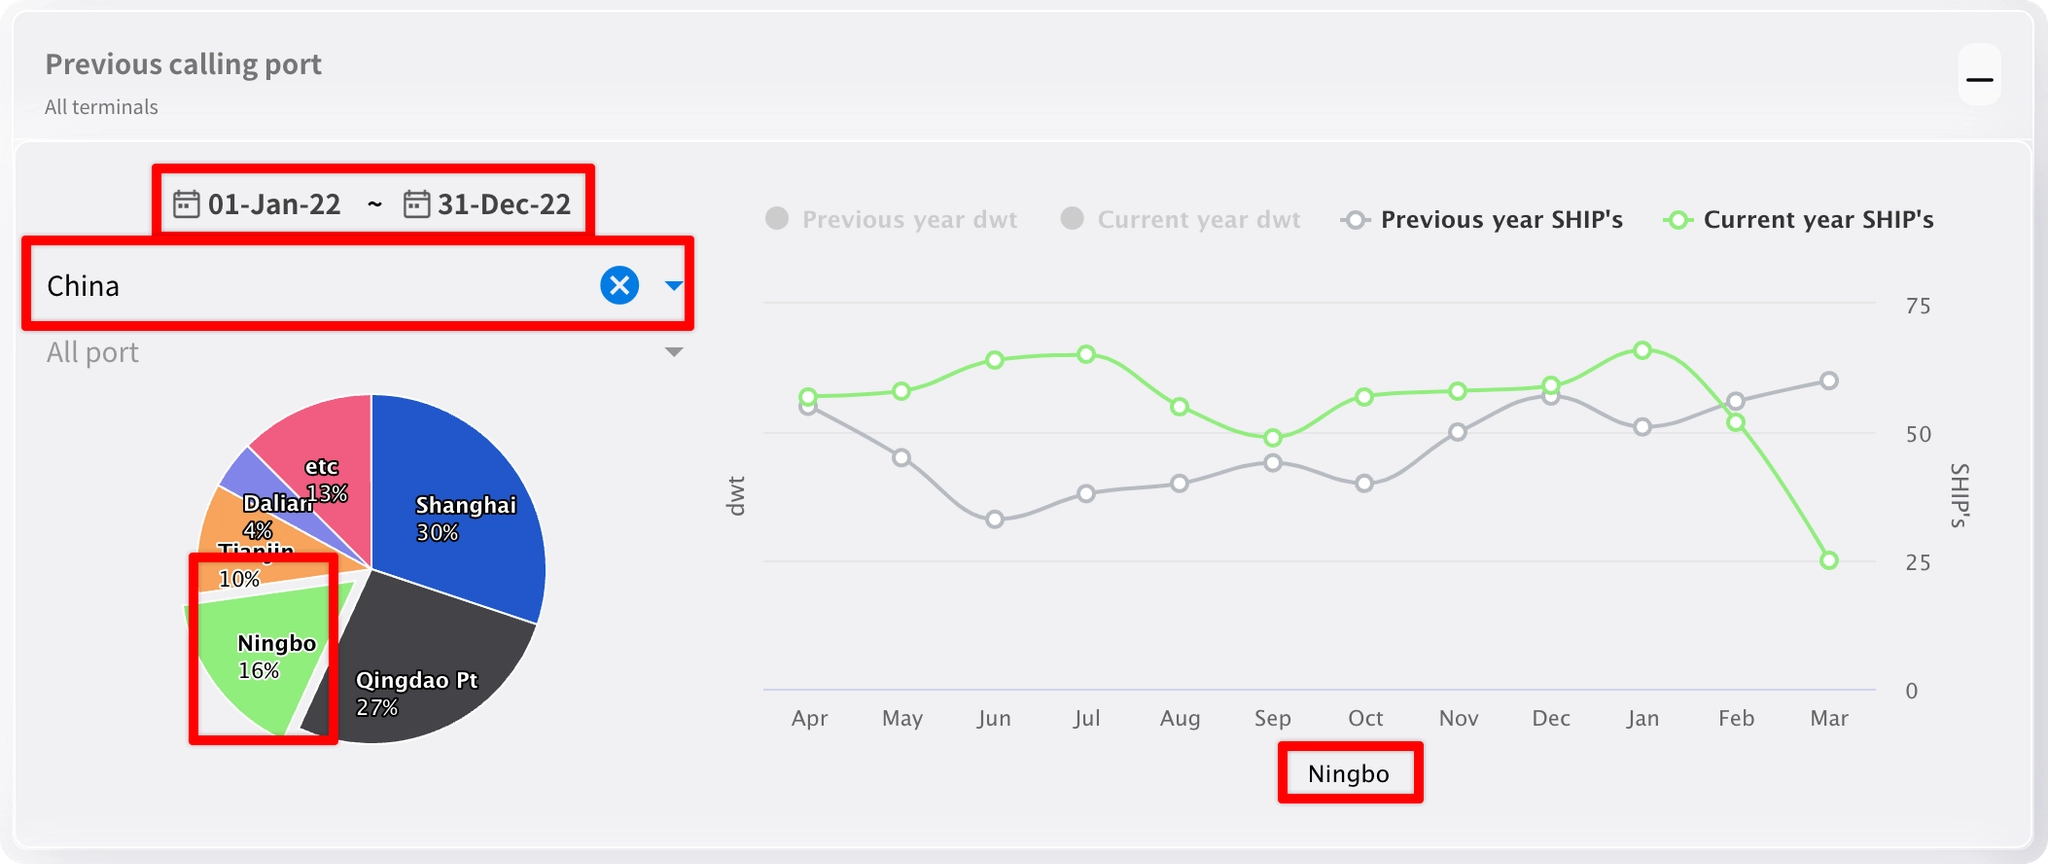
Port of Call Statistics Chart
Charts DWT and vessel count statistics for the Previous & Next Calling Port based on the selected port or terminal.
Chart Items
•
Previous calling port Vessel count and volume statistics
•
Next calling port Vessel count, volume statistics
How to set up a chart
•
You can set the time period to view, filter by country, port, or terminal, and view details.
•
Duration only applies to pie charts.
◦
Set a time period only
: You can click on a country in the pie chart to see a chart of statistics by country.
◦
Set time period, country
: Click a port in the pie chart to see a chart of statistics by port in that country.
◦
Set time periods, countries, and specific ports
: Click a terminal in the pie chart to see a chart of statistics by terminal for a specific port in that country.