

View real-time port congestion indicators and operational conditions for each port.
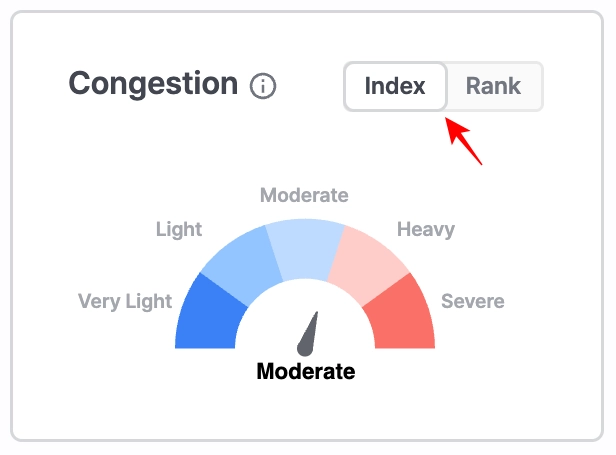
Congestion
•
Index: Shows the current congestion level compared to historical patterns for the selected port. Data updates every 15 minutes.
•
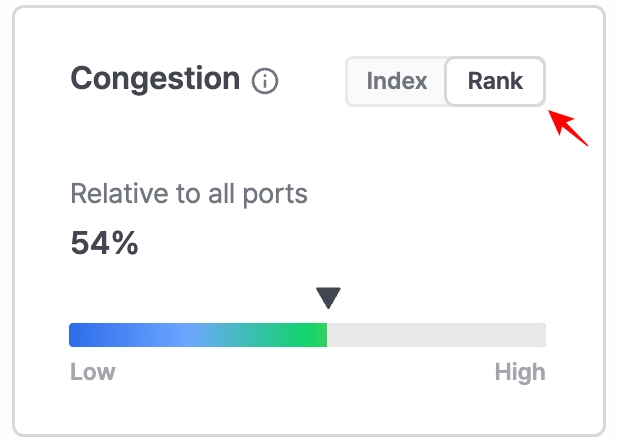
Rank: Displays how congested the selected port is relative to all ports supported in Port Insight. Data updates every 15 minutes.
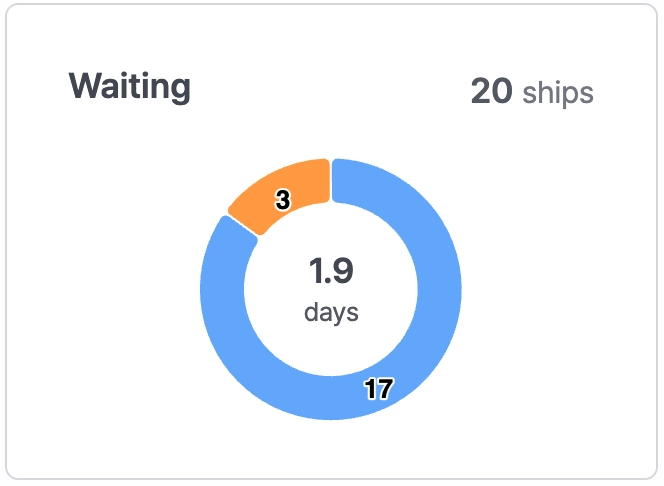
Waiting
•
Top value: Total number of vessels currently waiting.
•
Middle value: Average waiting days of vessels currently in queue.
•
Blue range: Vessels within the normal waiting range.
•
Orange range: Vessels experiencing delays beyond the normal waiting range.
•
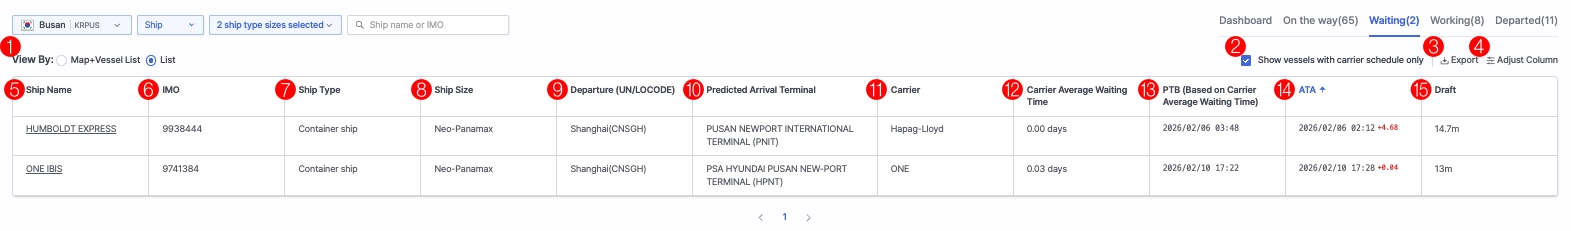
Click the Waiting tab at the top to display the list of vessels currently waiting at the port. For each vessel, you can review detailed berthing information (PTB) and arrival information (ATA).
•
Data is updated every 15 minutes.
No. | Field | Description |
1 | View By | Select between Map+Vessel List or List view |
2 | Show vessels with carrier schedule only | Display only Waiting vessels analyzed based on carrier schedule data |
3 | Export | Download the vessel list |
4 | Adjust Column | Customize the columns displayed in the table |
5 | Ship Name | Vessel name |
6 | IMO | IMO number |
7 | Ship Type | Vessel type |
8 | Ship Size | Vessel size |
9 | Departure (UN/LOCODE) | Port of departure |
10 | Predicted Arrival Terminal | Predicted arrival terminal |
11 | Carrier | Carrier operating the vessel (displayed for schedule-based vessels only) |
12 | Carrier Average Waiting Time | Average waiting time based on the operating carrier (displayed for schedule-based vessels only) |
13 | PTB (Based on Carrier Average Waiting Time) | Predicted berthing time calculated based on the operating carrier’s average waiting time |
14 | ATA | Actual arrival time, including waiting duration |
15 | Draft | Vessel draft |
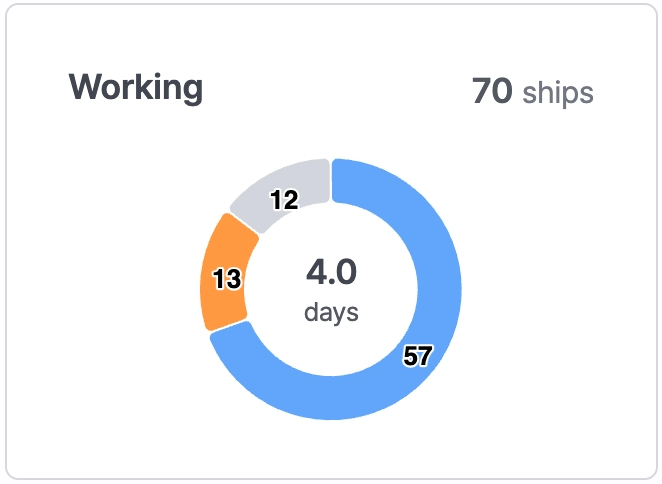
Working
•
Top value: Number of vessels currently berthed.
•
Middle value: Average working days of vessels currently berthed.
•
Blue range: Normal working time range.
•
Orange range: Delayed vessels based on average working time.
•
Gray range: Vessels berthed at shipyards.
•
Clicking the Working tab displays the full list of berthed vessels with ATA/ATB details.
•
Data updates every 15 minutes.
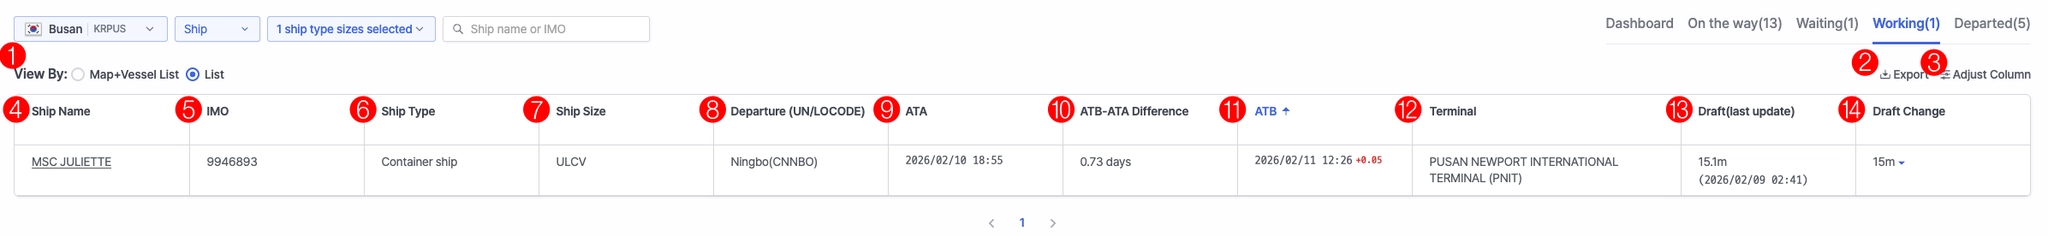
No. | Field | Description |
1 | View By | Select between Map+Vessel List or List view |
2 | Export | Download the vessel list |
3 | Adjust Column | Customize the columns displayed in the table |
4 | Ship Name | Vessel name. |
5 | IMO | IMO number |
6 | Ship Type | Vessel type |
7 | Ship Size | Vessel size |
8 | Departure (UN/LOCODE) | Port of departure |
9 | ATA | Actual Time of Arrival |
10 | ATB - ATA Difference | Time difference between ATB and ATA |
11 | ATB | Actual Time of Berthing |
12 | Terminal | Name of the arrival terminal |
13 | Draft(last update) | Vessel draft (last updated time) |
14 | Draft Change | Increase or decrease in vessel draft |
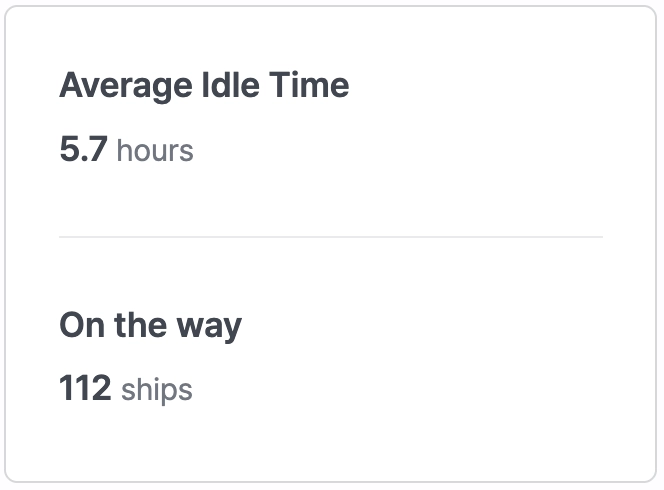
Average Idle Time / On the way
•
Average Idle Time: The average idle time of vessels currently en route to the port.
•
On the way: Number of vessels currently sailing toward the port.
•
Click the On the Way tab at the top to display the list of vessels currently en route to the selected port. For each vessel, you can review predicted arrival information, including ETA, PTA, and PTB.
•
Average Idle Time and On The Way data update every 15 minutes.
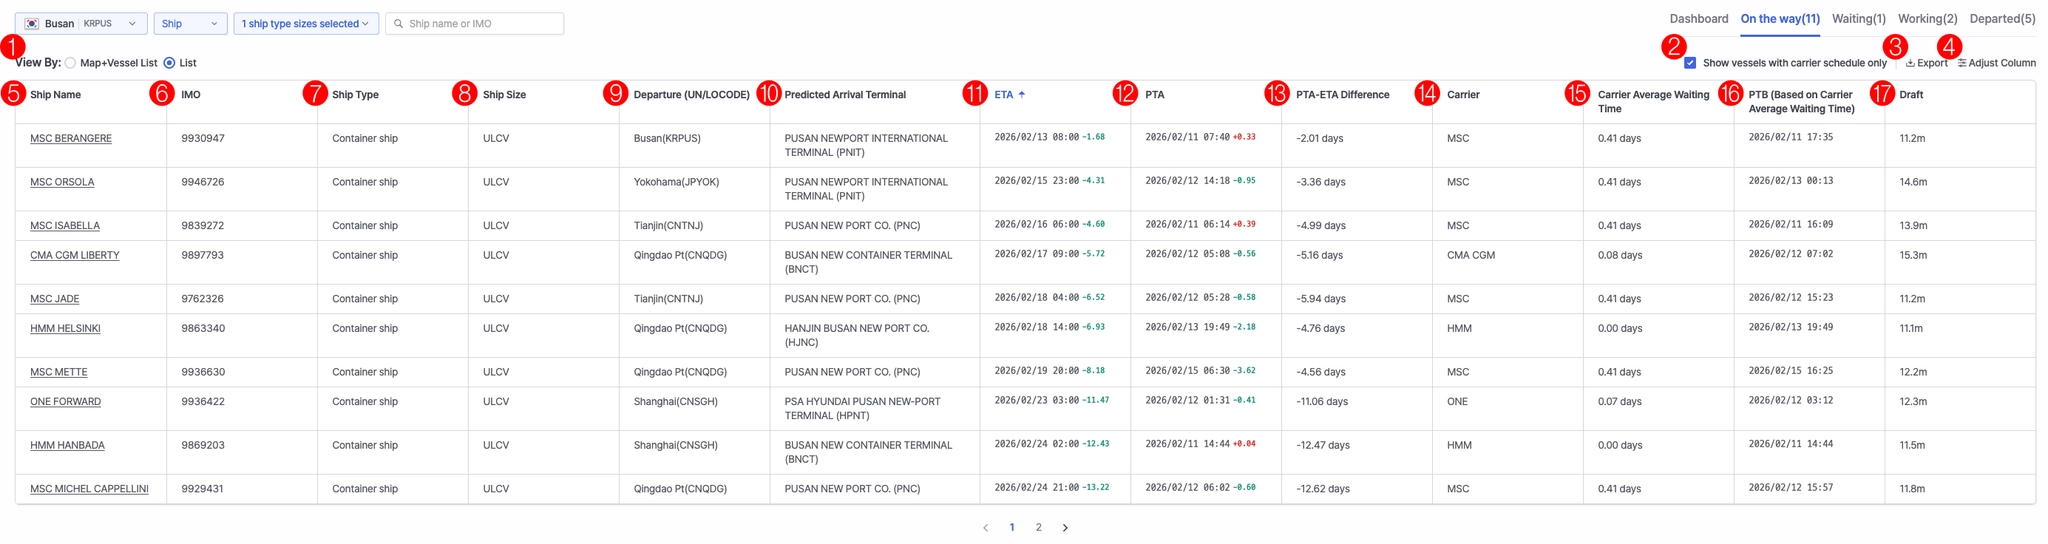
No. | Field | Description |
1 | View By | Select between Map+Vessel List or List view |
2 | Show vessels with carrier schedule only | Display only Waiting vessels analyzed based on carrier schedule data |
3 | Export | Download the vessel list |
4 | Adjust Column | Customize the columns displayed in the table |
5 | Ship Name | Vessel name |
6 | IMO | IMO number |
7 | Ship Type | Vessel type |
8 | Ship Size | Vessel size |
9 | Departure (UN/LOCODE) | Port of departure |
10 | Predicted Arrival Terminal | Predicted arrival terminal |
11 | ETA | Estimated time of arrival |
12 | PTA | Predicted time of arrival |
13 | PTA-ETA Difference | Time difference between PTA and ETA |
14 | Carrier | Carrier operating the vessel (displayed for schedule-based vessels only) |
15 | Carrier Average Waiting Time | Average waiting time based on the operating carrier (displayed for schedule-based vessels only) |
16 | PTB (Based on Carrier Average Waiting Time) | Predicted berthing time calculated based on the operating carrier’s average waiting time |
17 | Draft | Vessel draft |
Departed
•
Clicking the Departed tab displays vessels that have completed departure, including ATA, ATB, and ATD information.
•
Data updates every 15 minutes.
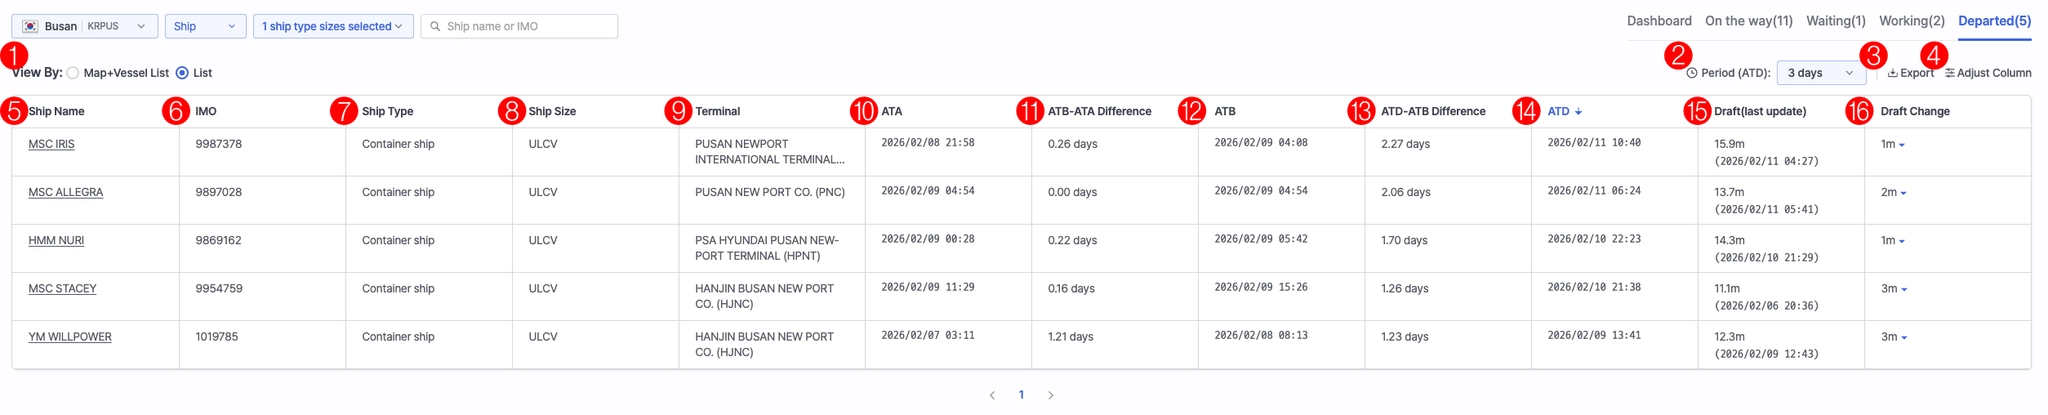
No. | Field | Description |
1 | View By | Select between Map+Vessel List or List view |
2 | Period (ATD) | Select ATD time range |
3 | Export | Download the vessel list |
4 | Adjust Column | Customize the columns displayed in the table |
5 | Ship Name | Vessel name |
6 | IMO | IMO number |
7 | Ship Type | Vessel type |
8 | Ship Size | Vessel size |
9 | Terminal | Terminal name |
10 | ATA | Actual arrival time |
11 | ATB-ATA Difference | Time difference between ATB and ATA |
12 | ATB | Actual berthing time |
13 | ATD-ATB Difference | Time difference between ATD and ATB |
14 | ATD | Actual departure time |
15 | Draft(last update) | Latest draft value |
16 | Draft Change | Increase/decrease in draft |
Congestion Index Trend
Index Trend
•
Displays congestion levels scaled from 1 to 10, based on the current congestion compared to long-term average conditions. Higher values indicate heavier congestion.
•
Data updates every 4 hours.
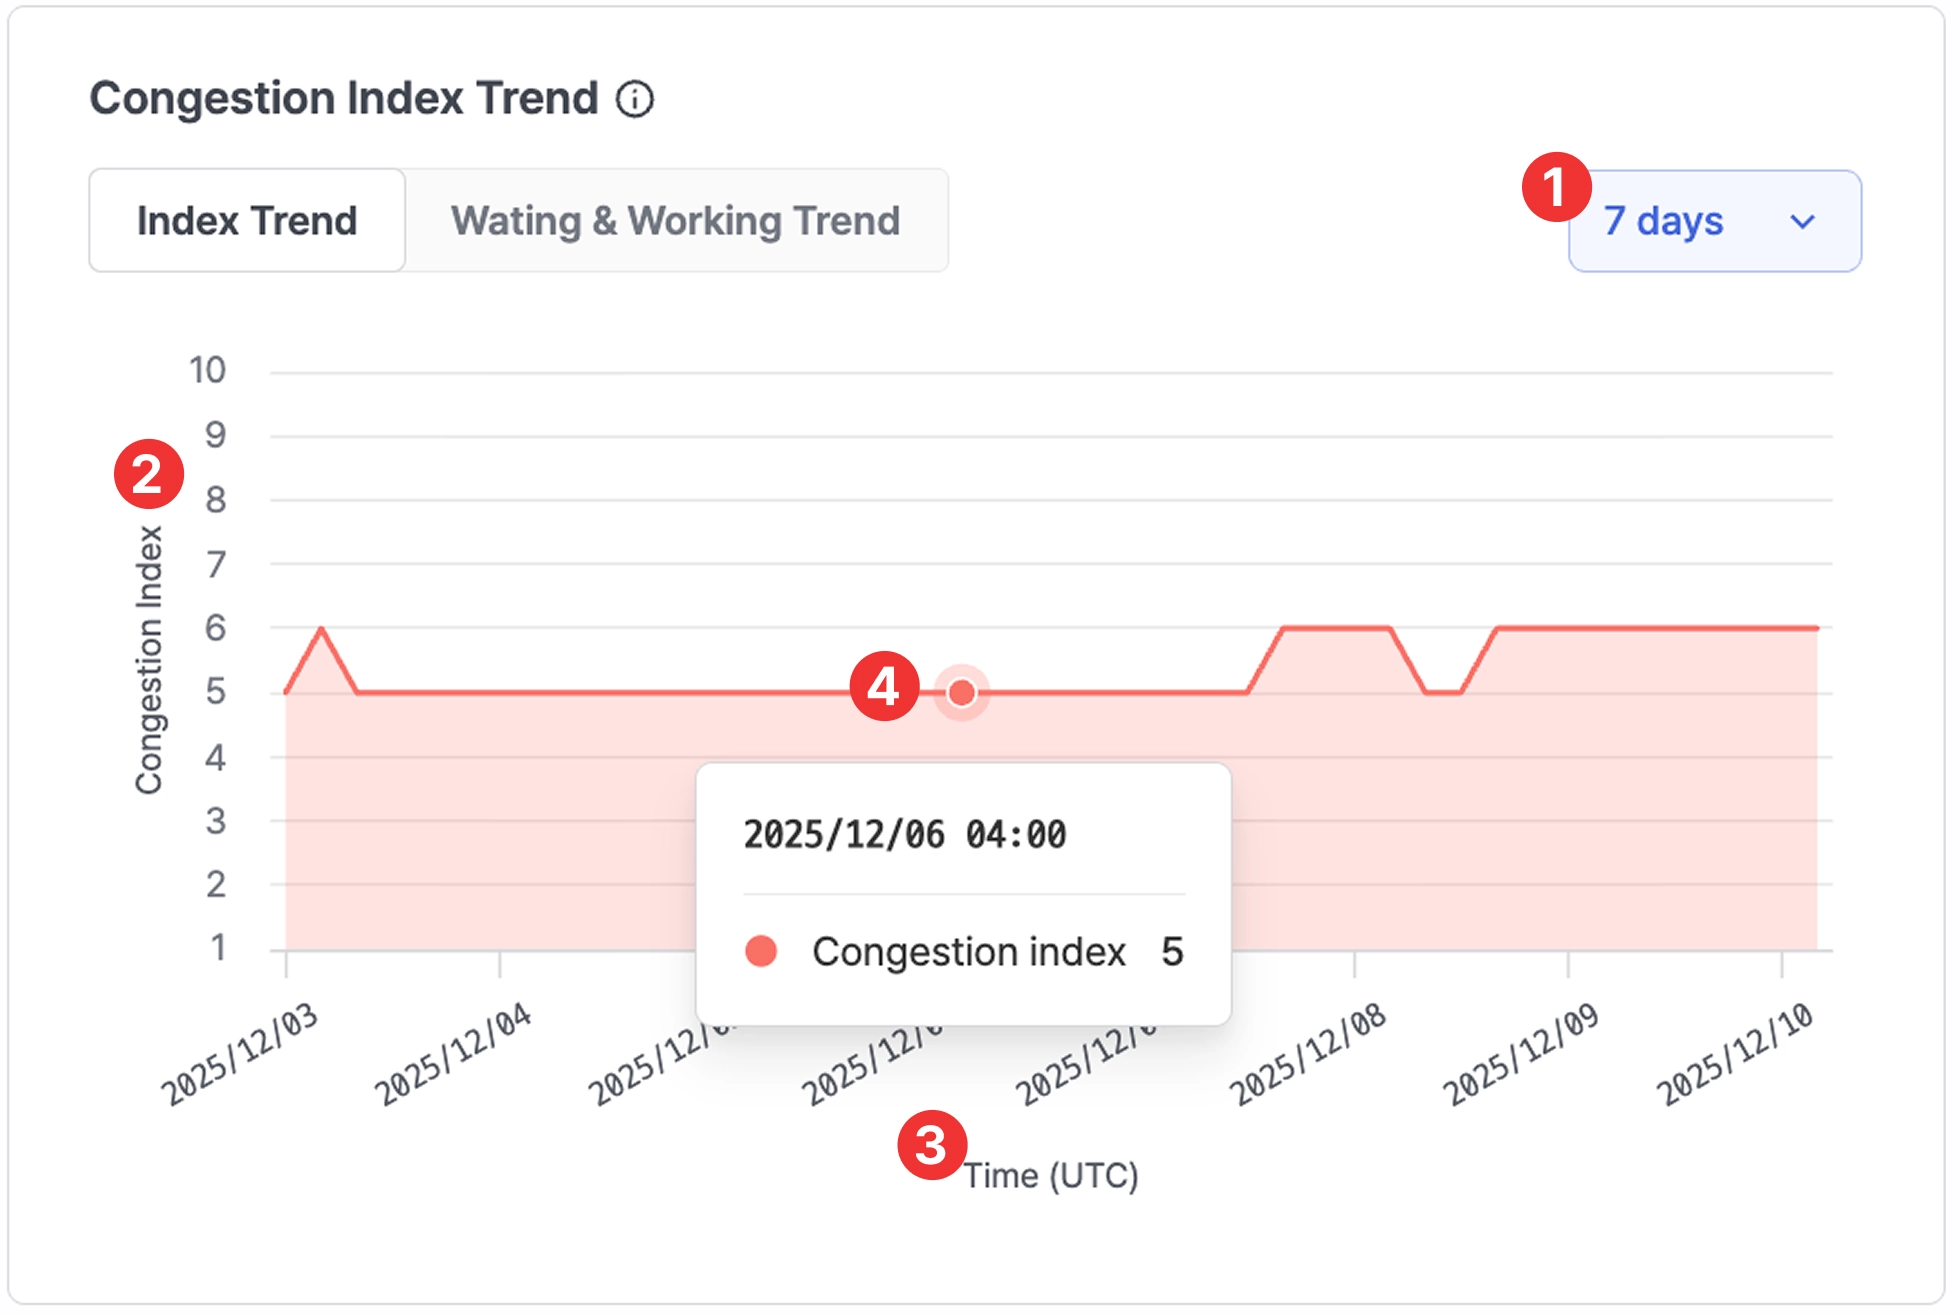
Port insight > Congestion Index Trend > Index Trend 7-day view
No. | Field | Description |
1 | Period selection | Select period from the dropdown |
2 | Congestion index | Congestion score (see table below) |
3 | Time (UTC) | Timestamp |
4 | Value on hover | Hover over the chart to view exact values |
*Congestion Index Score
Range | Level | Description |
1–2 | Very Light | No delay or extremely smooth operations |
3–4 | Light | Better-than-average conditions |
5–6 | Moderate | Normal operations with minor waiting possible |
7–8 | Heavy | Increased waiting times or operational delays |
9–10 | Severe | Significant delays; port operating at near-capacity |
Waiting & Working Trend
•
Shows the average number of vessels and days spent waiting or working at the port.
•
Periods of 7, 30, 60, 90 days can be selected from the filter.
•
Data updates every 4 hours.
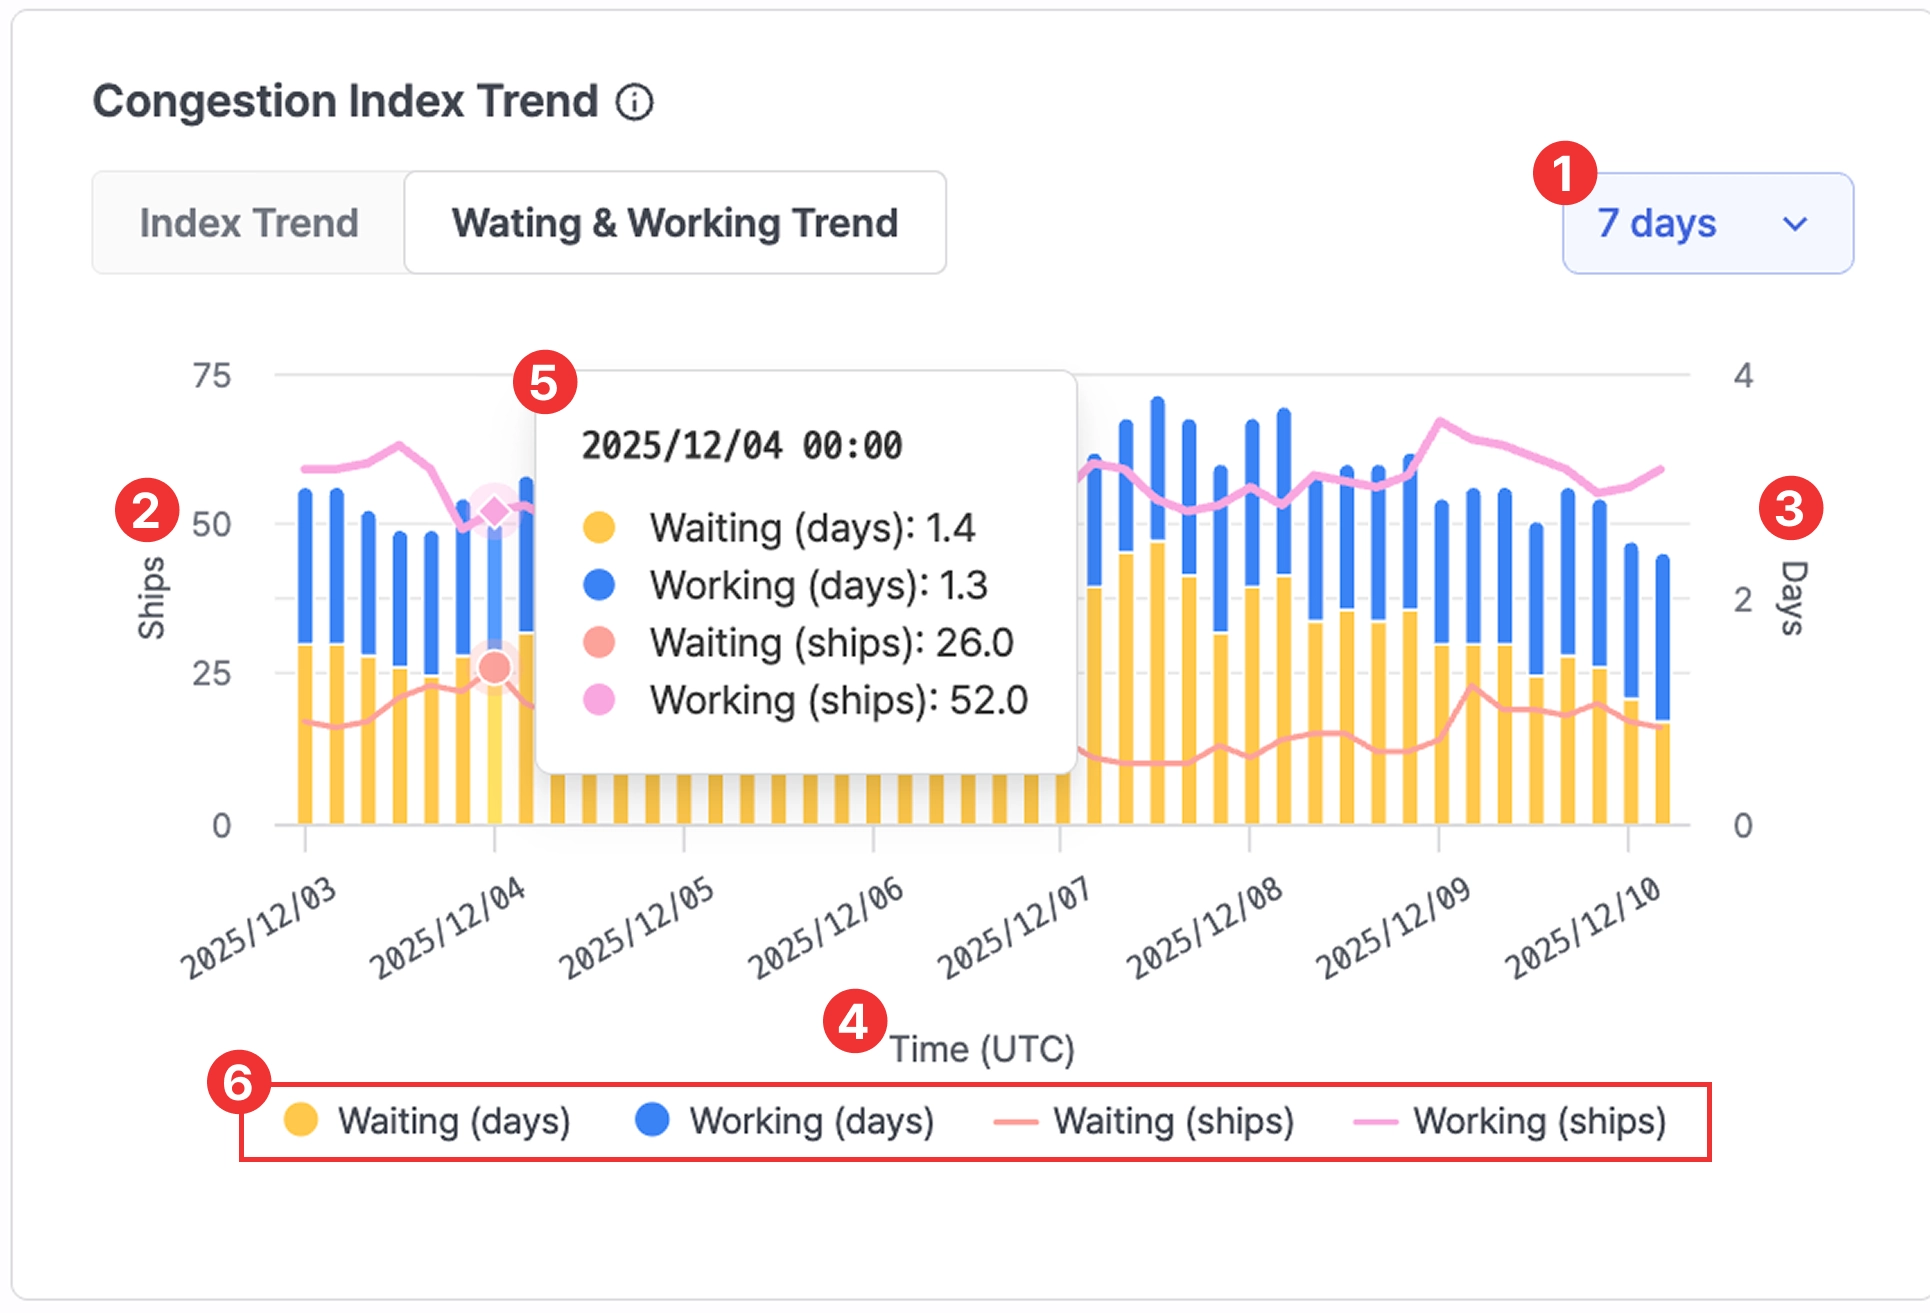
Port insight > Congestion Index Trend > Waiting & Working Trend 7-day view
No. | Field | Description |
1 | Period selection | Select viewing period |
2 | Ships | Waiting/working vessel counts |
3 | Days | Waiting/working days |
4 | Time | Timestamp |
5 | Value on hover | Hover to view exact values |
6 | Legend | Click the legend buttons to show or hide specific metrics on the chart.
- Waiting (days)
- Working (days)
- Waiting (ships)
- Working (ships) |