

This section provides an overview of the main components of the Port Insight feature at a glance.
General
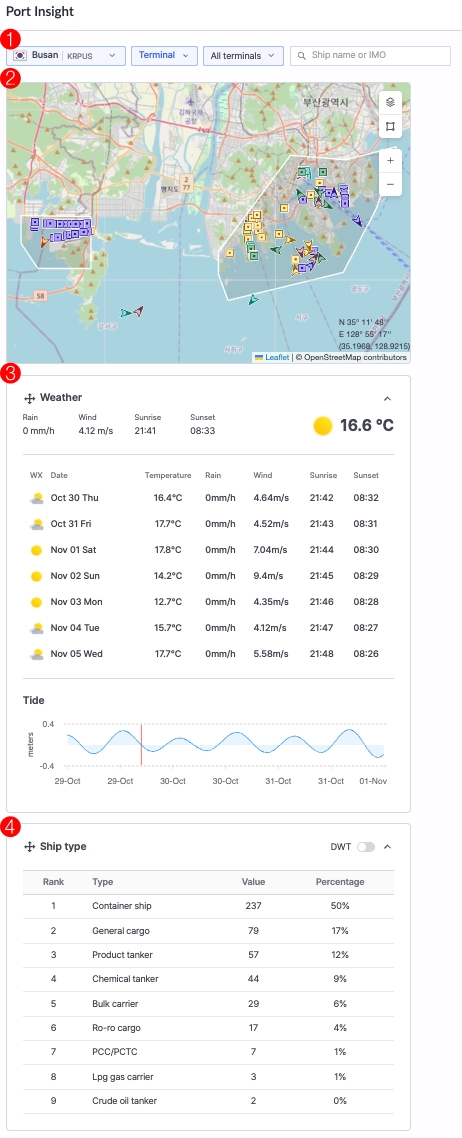
1. Filter
•
Port : Select the port you wish to view.
•
Terminal/Ship : Choose whether to display information based on terminals or ship types.
•
All terminals/All Ships : Select the specific terminal or ship type to view according to your chosen criteria.
•
Search Bar: Enter a vessel name or IMO number to search for a specific ship.
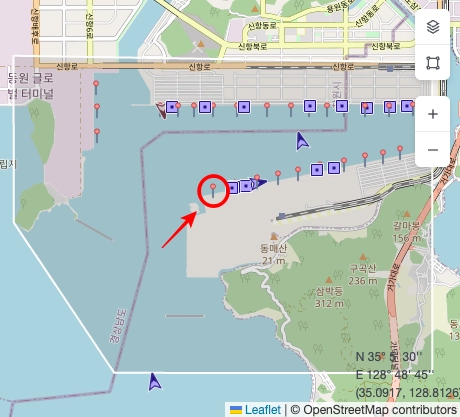
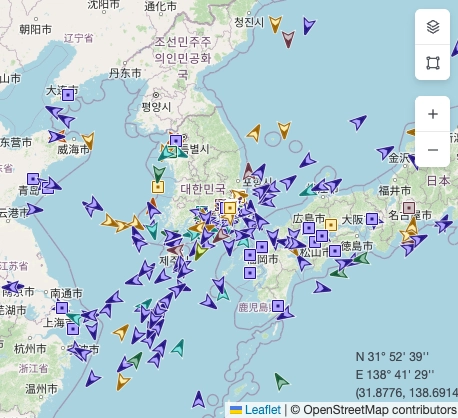
2. Map
•
Displays vessels related to the selected port, allowing you to check real-time congestion at the port.
•
Zoom in to view individual berths.
•
Zoom out to display all vessels arriving, waiting, working, or departing from the port.
Notes
•
When Dashboard is selected, all vessels are displayed on the map.
•
When On the Way, Waiting, Working, or Departed is selected, only vessels in the corresponding status are shown.

•
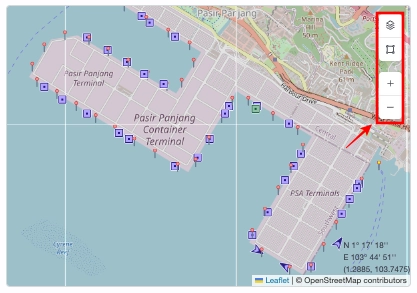
You can configure Layer, Tools, and Zoom In/Out functions.
3. Weather / Tide
•
Provides information on the port’s temperature, precipitation, wind speed, sunrise/sunset times, and tide conditions.
4. Ship Type
•
Displays the number of vessels by ship type and sorts them by DWT (Deadweight Tonnage) by ship type.
Notes
•
The Weather and Ship Type panels can be repositioned vertically (up or down).
Dashboard
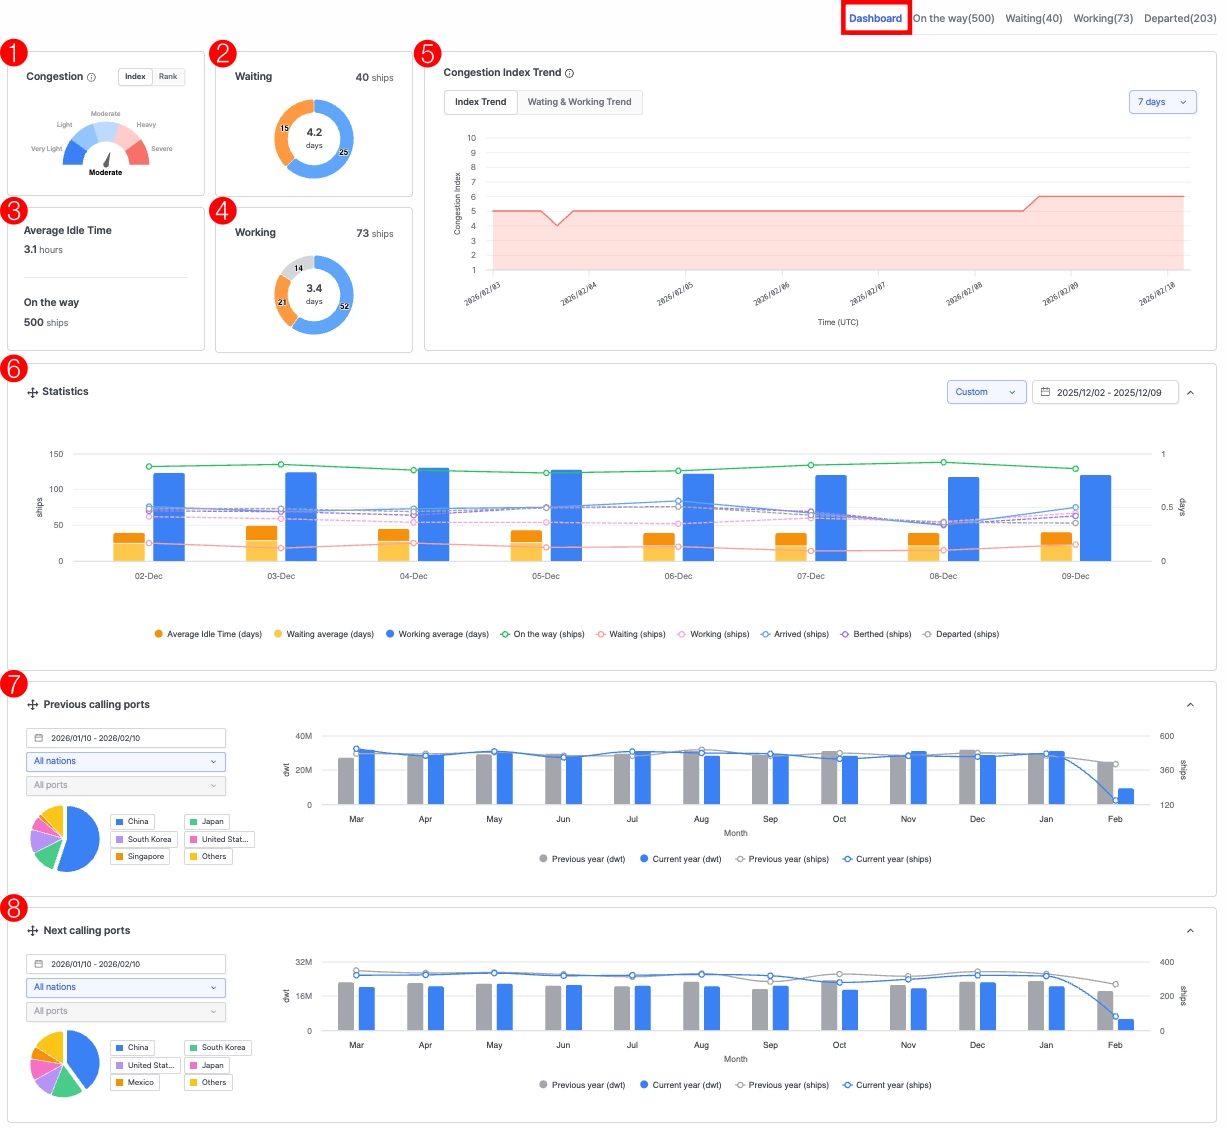
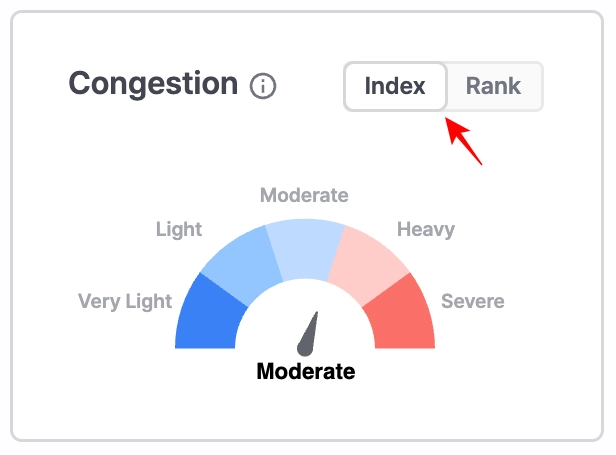
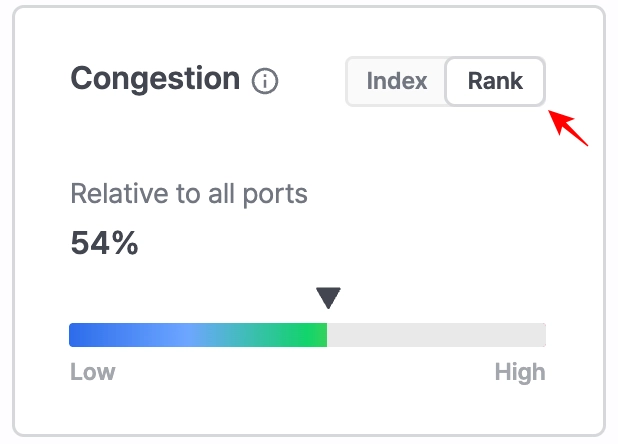
1. Congestion
•
Index: Indicates the current congestion level of the port compared to historical averages.
•
Rank: Shows how the port’s congestion level compares with all other ports available in the Port Insight service.
2. Waiting
•
Top Figure: Displays the current number of vessels waiting at the port.
•
Center Figure: Shows the average waiting days of vessels currently waiting at port.
•
Blue Segment: Represents vessels whose waiting times are within the normal range based on the port’s historical averages.
•
Yellow Segment: Represents vessels whose waiting times exceed the average or expected threshold.
3. Average Idle Time / On the way
•
Average Idle Time: The average idle time of vessels currently en route to the port.
•
On the way: The number of vessels currently sailing toward the port.
4. Working
•
Top Figure: Displays the current number of vessels berthed at the port.
•
Center Figure: Shows the average working (berthing) days of vessels currently at berth.
•
Blue Segment: Represents vessels whose working times are within the normal range based on the port’s historical averages.
•
Yellow Segment: Represents vessels whose working times exceed the average or expected threshold.
•
Gray Segment: Represents vessels currently berthed at a shipyard.
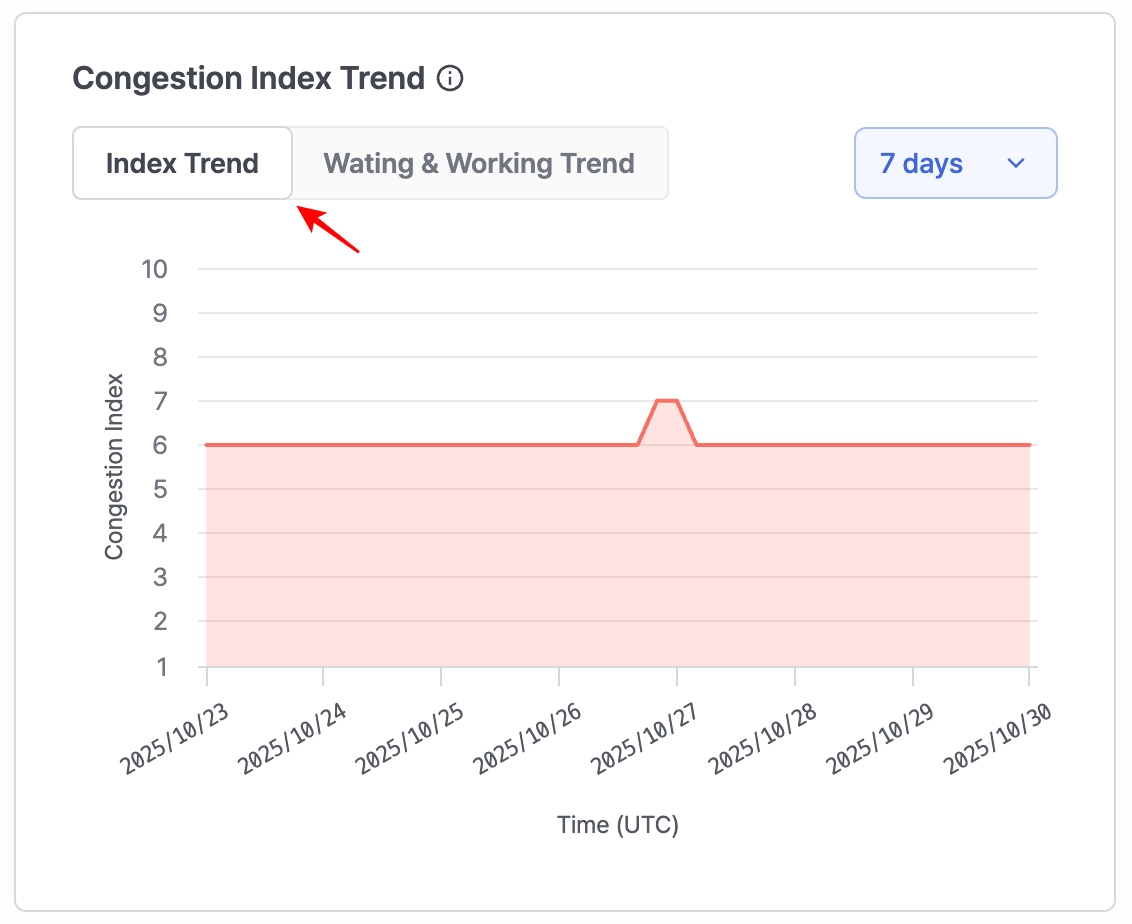
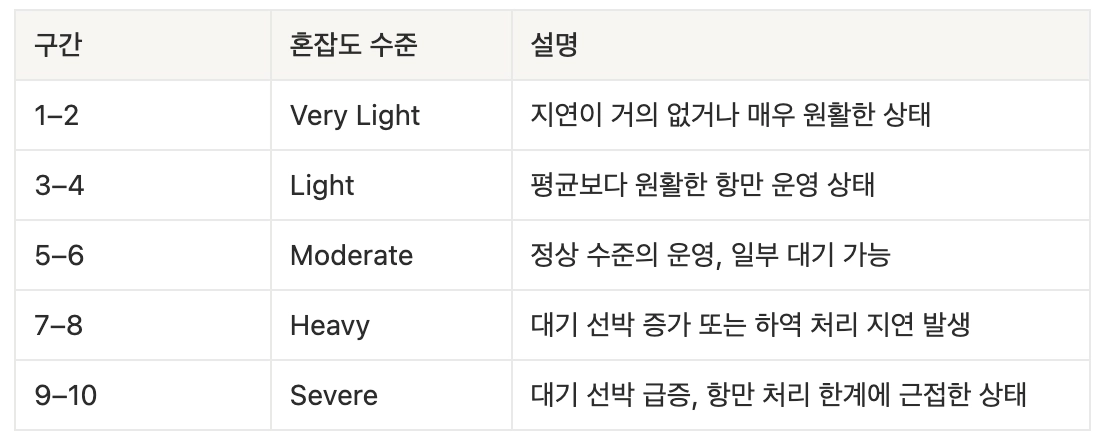
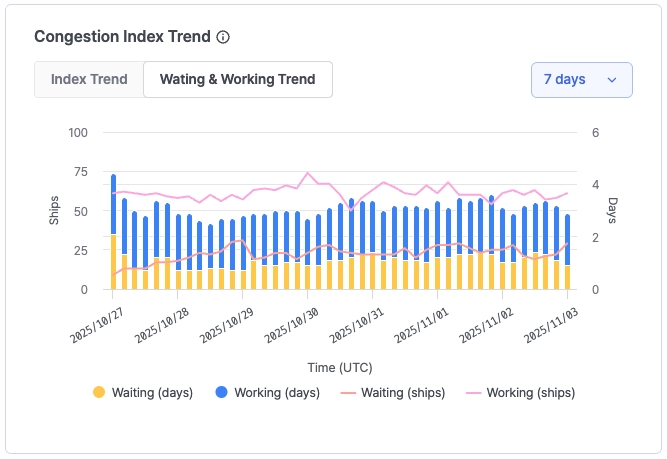
5. Congestion Index Trend
•
Index Trend
◦
A quantified indicator (ranging from 1 to 10) showing the current congestion level compared to the real-time average.
◦
A higher score indicates greater congestion or waiting time within the port. The data is updated every four hours.
•
Waiting & Working Trend
◦
Displays the current number of waiting and working vessels and their corresponding average days compared to port averages.
◦
Data is updated every four hours.
◦
The trend can also be viewed over 7, 30, 60, or 90 days using the filter on the right-hand panel.
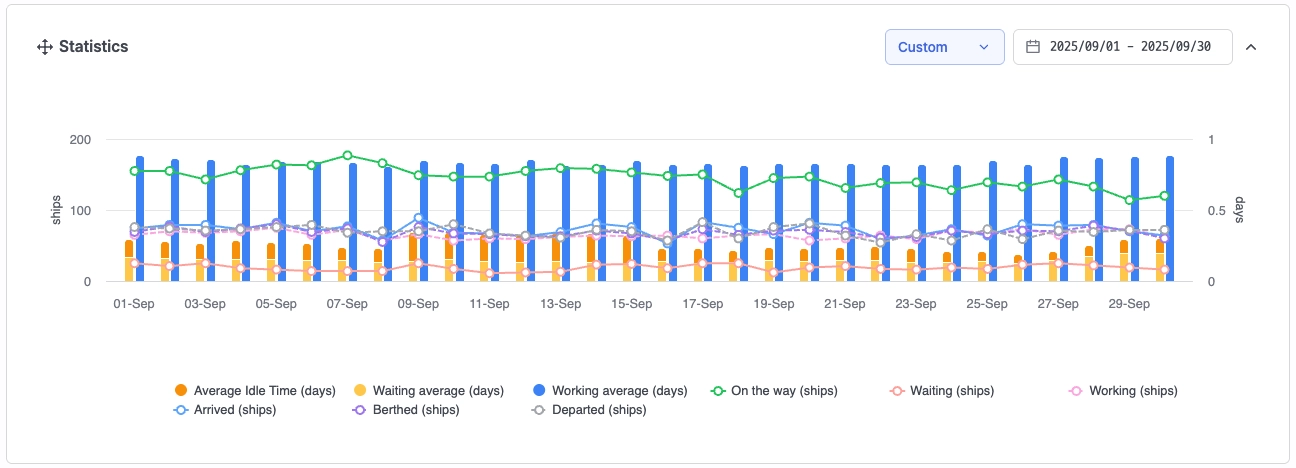
6. Statistics
•
Provides charts showing vessel statistics by port, terminal, or ship type over a selected period.
•
You can view trends over 7 days, 30 days, 60 days, 90 days, 12 months, or a custom period using the filters on the right-hand panel.
•
Click the legend buttons to toggle each indicator ON/OFF and display only the desired metrics.
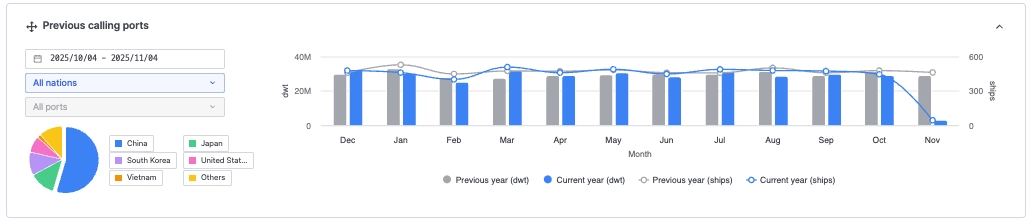
7. Previous calling ports
•
Provides charts showing the DWT and number of vessels from previous ports that called at the selected port or terminal.
•
Use the filter panel on the left to view trends by date, country, or port.
•
Click the legend buttons to toggle each indicator ON/OFF and display only the desired metrics.
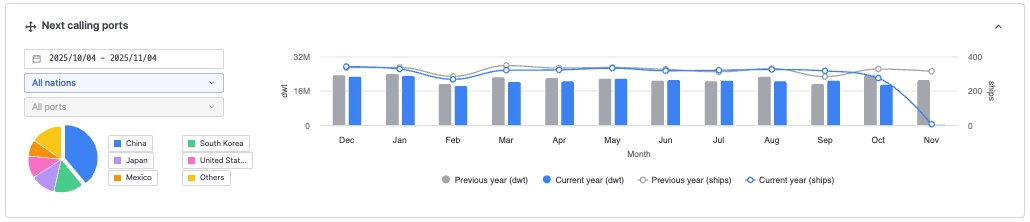
8. Next calling ports
•
Provides charts showing the DWT and number of vessels bound for the next ports from the selected port or terminal.
•
Use the filter panel on the left to view trends by date, country, or port.
•
Click the legend buttons to toggle each indicator ON/OFF and display only the desired metrics.
Notes
•
The Statistics, Previous Calling Ports, and Next Calling Ports panels can be repositioned vertically (up or down).
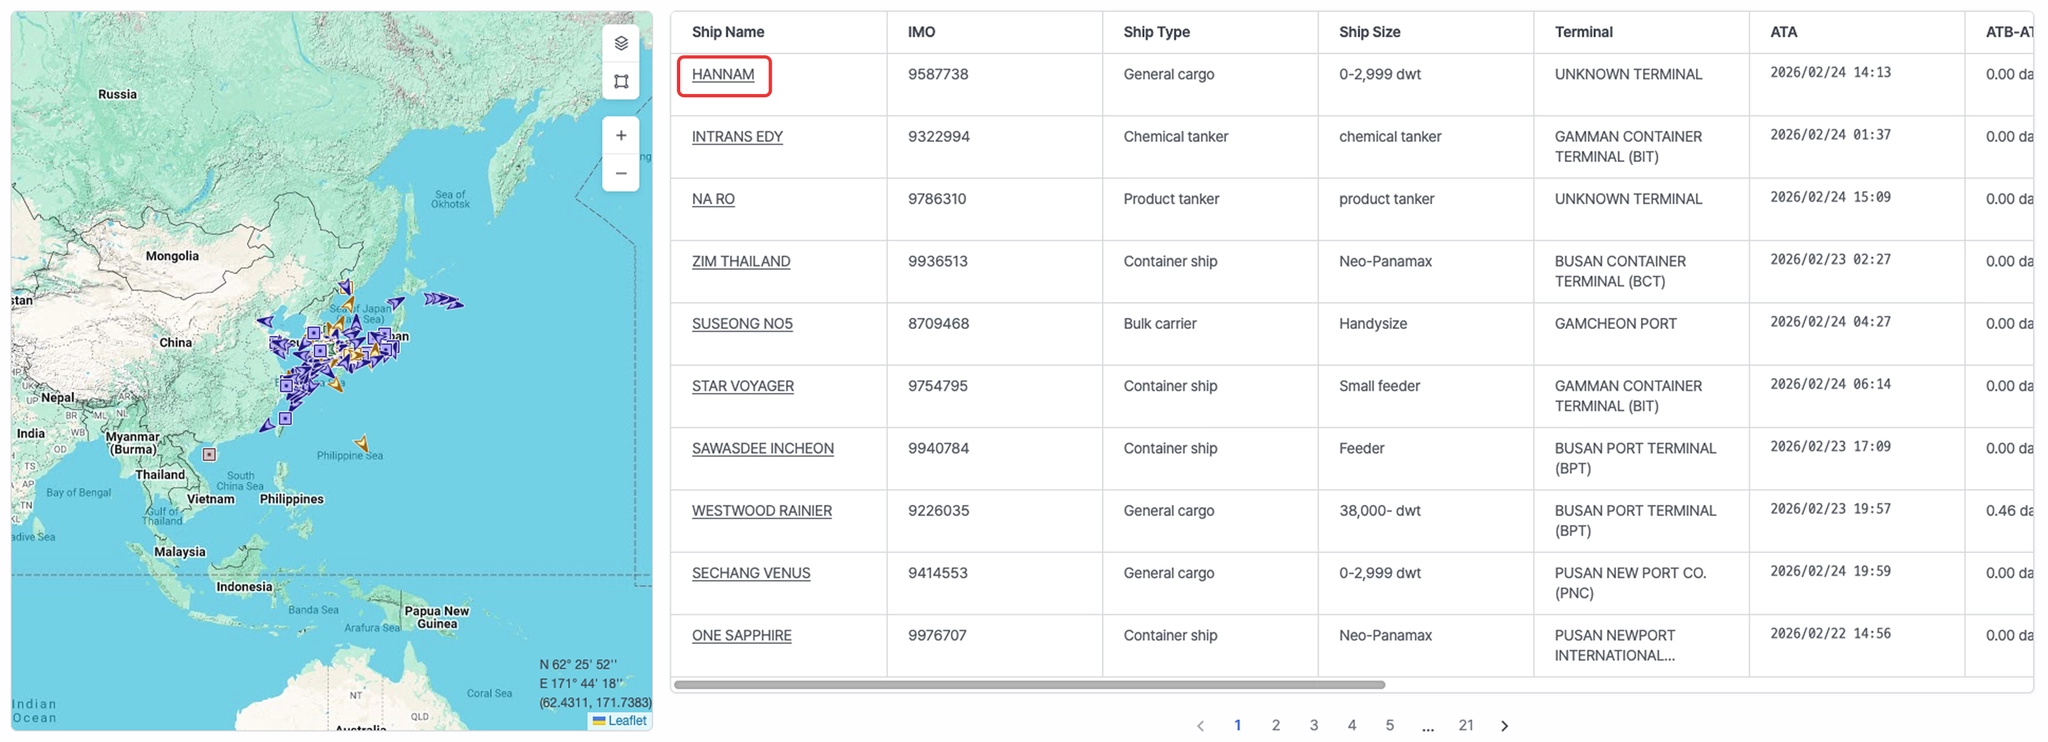
On the way / Waiting / Working / Departed
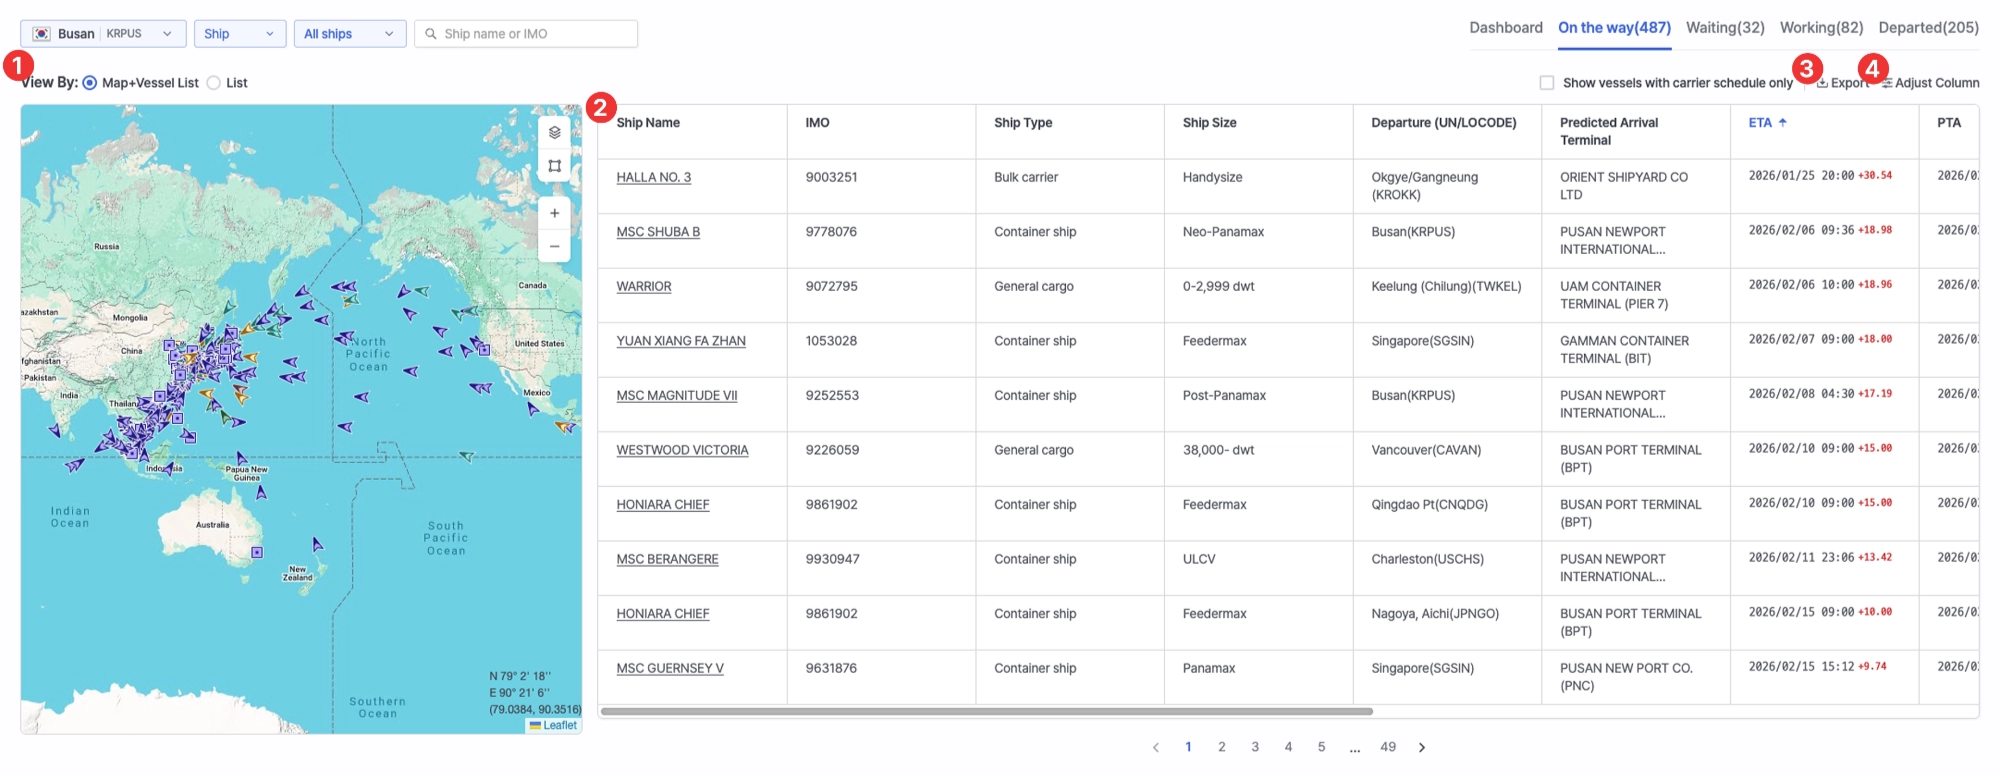
1. View By
•
Select between Map + Vessel List or List view.
2. Vessel List
•
On the way: Displays vessels currently en route to the selected port. You can review predicted arrival information, including ETA, PTA, and PTB.
•
Waiting: Displays vessels currently waiting at the port. Detailed arrival information (ATA) is available for each vessel.
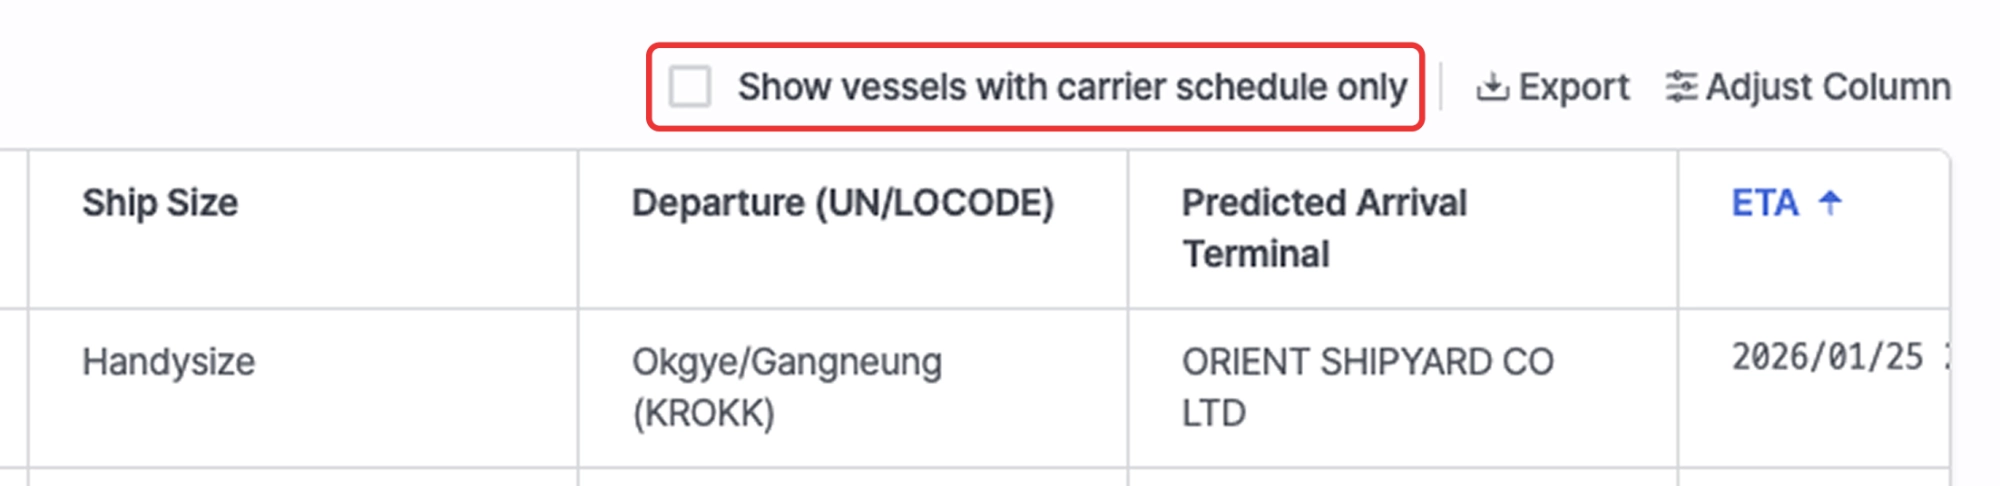
◦
By selecting Show vessels with carrier schedule only, you can filter the On the Way and Waiting lists to include only vessels analyzed based on carrier schedule data.
•
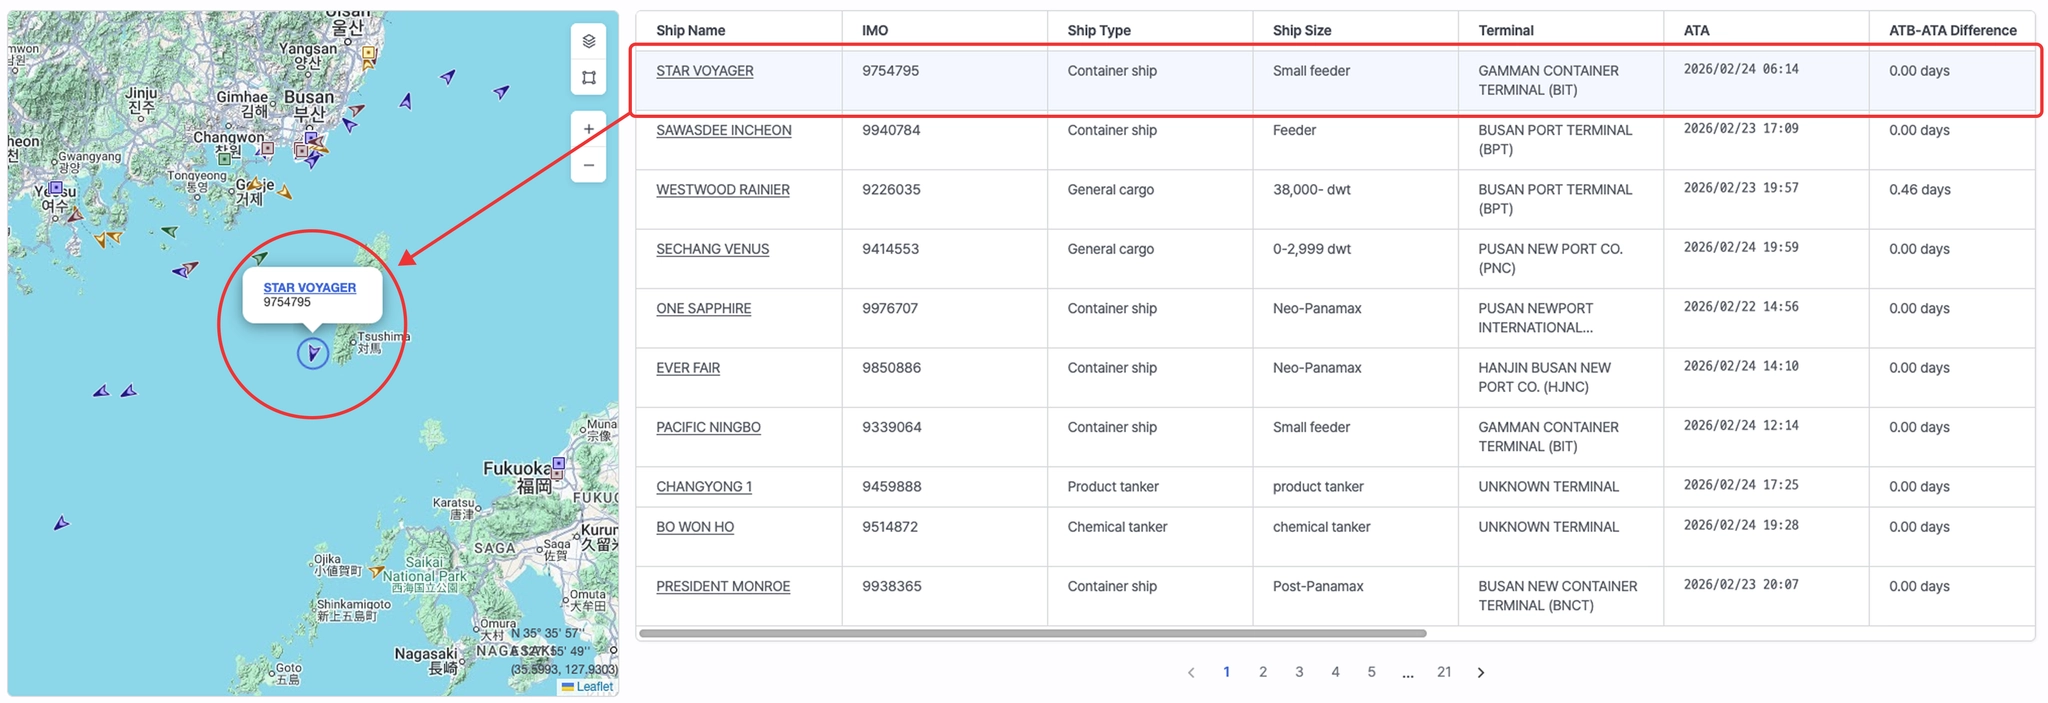
Working: Displays vessels currently berthed at the port. Arrival and berthing information (ATA, ATB) can be reviewed.
•
Departed: Displays vessels that have completed departure. Arrival, berthing, and departure information (ATA, ATB, ATD) is available.
◦
You can view vessels that departed within the selected date range.
•
Clicking a vessel displays its location on the map panel on the left.
•
Clicking the vessel name expands the real-time vessel tracking view for detailed monitoring.
2. Export
•
Export the current vessel list to an Excel file.

3. Adjust Column
•
Customize the table columns by selecting and arranging the fields according to your preference.